Render Price Prediction: Is RENDER Ready for a Bigger Move ?

Render has spent much of the past year fighting to hold its ground, and the latest Render price prediction conversation is starting to shift more hopeful.
After a long stretch of grinding lower, the token has picked up momentum over the past few sessions, drawing fresh attention from traders watching whether this move has real legs.
The tone around RENDER feels noticeably less defensive than it did weeks ago.
RENDER Price Today
RENDER is trading near $1.542, up 4.61% in the past 24 hours, according to Coinglass data, with an intraday range of $1.502 to $1.569.
Market cap sits at $799.87 million on a circulating supply of 518.77 million tokens against a 644.16 million max supply.
Futures volume came in at $67.30 million versus $21.25 million in spot volume, with open interest at $52.62 million.
Binance leads with $21.82 million in 24-hour futures volume, ahead of LBank, Bybit, and OKX.
How Has RENDER Performed Across Timeframes?
RENDER is up 10.10% over the past week and 17.53% over the past month, though it's still down 5.95% over 90 days and carries a steep 54.82% loss over the past year, even as the near-term trend turns constructive.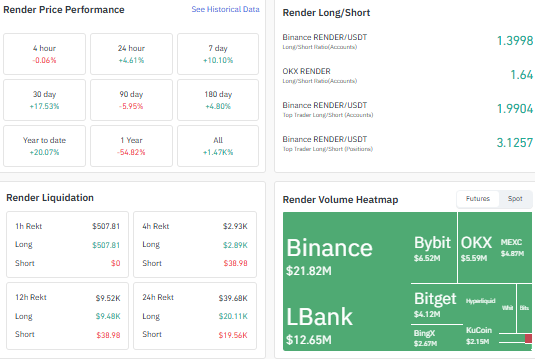
Positioning across crypto derivatives leans bullish: Binance's long-short account ratio sits at 1.3998, OKX at 1.64, and Binance's top-trader positions are skewed further to 3.1257, suggesting larger traders are leaning long with real size.
Liquidations over 24 hours totaled $39.68K, split evenly between $20.11K long and $19.56K short, a mixed picture rather than one-sided forced selling.
RENDER Open Interest Analysis
Per Coinglass data , open interest stood at $52.41 million as of September 7, up from the $20 million to $30 million range held through June to August.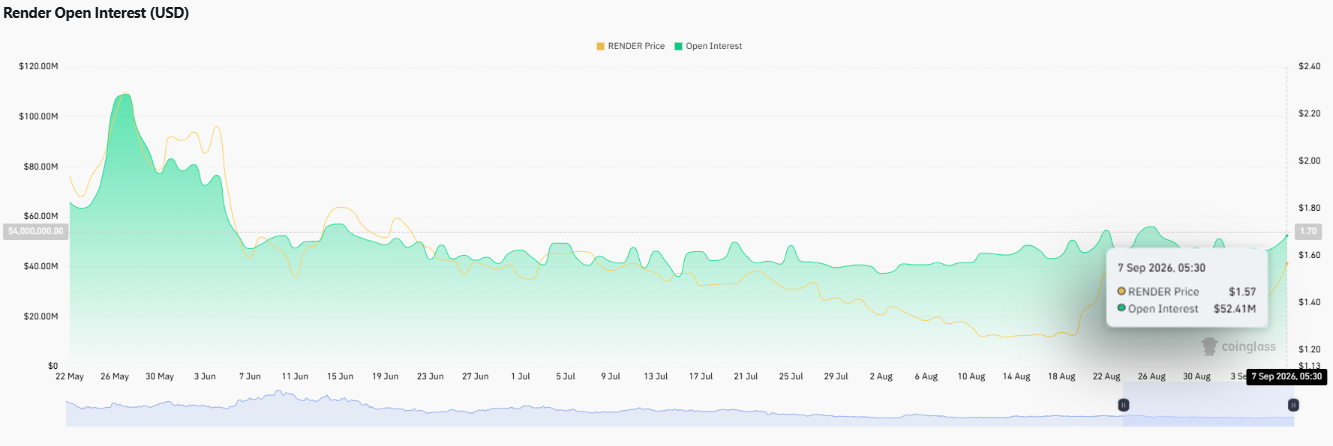
It peaked above $100 million in late May near the price's recent highs before contracting through summer, and the current uptick suggests fresh capital entering as the price recovers.
How Concentrated Is RENDER Token Ownership?
On-chain data adds another layer to RENDER's holder concentration picture: the top 100 addresses control 96.06% of supply, and whale wallets, just 0.07% of holders, control 95.77% of it, per Etherscan data.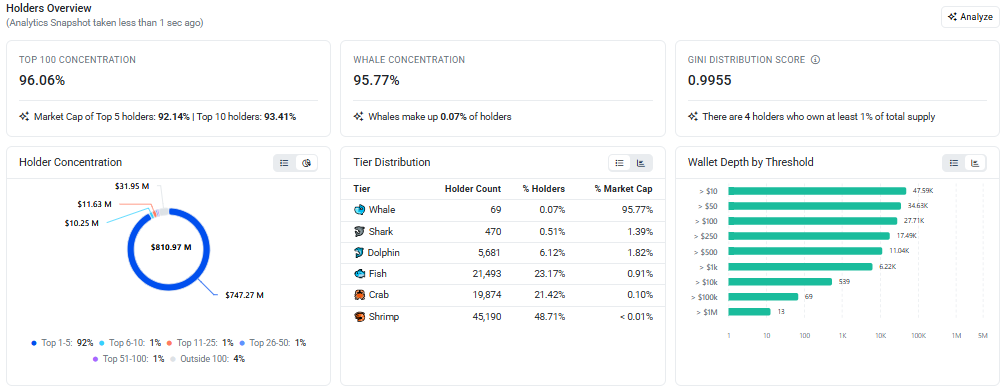
A Gini score of 0.9955 shows only four addresses own 1% or more of supply each, meaning large wallet moves can carry outsized weight on price.
What Does the Daily RENDER Chart Show?
On the daily TradingView chart , RENDER spent much of the year grinding through a falling wedge after peaking near $2.20 in early June, making lower highs and lows between two converging trendlines.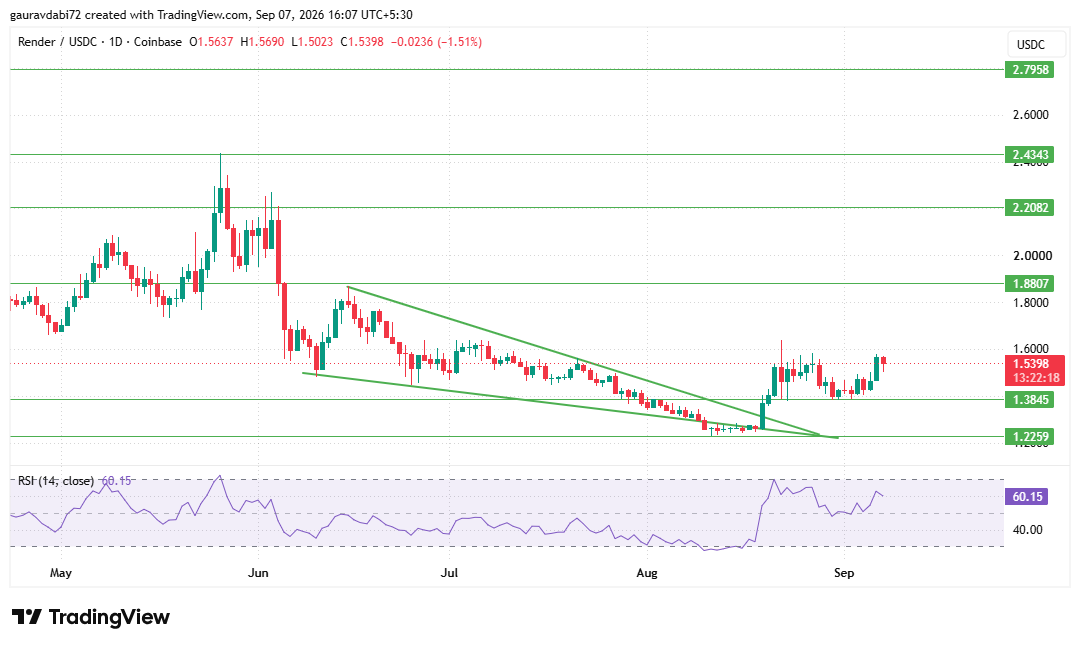
That resolved when RENDER found support near $1.2259 and pushed back through the $1.3845 level that had capped it for weeks.
Price has since climbed into the $1.54 to $1.55 area, right at the edge of a neutral zone running roughly $1.5417 to $1.8807.
RSI has moved up to 60.15, above the midline but nowhere near overbought, fitting a market that's recovering rather than overheating.
A volume-backed break above $1.8807 opens the path toward $2.2082, $2.4343, and $2.7958; a slip under $1.3845 puts $1.2259 back in focus.
Where Could RENDER Price Head From Here?
The near-term Render price prediction hinges on whether this bounce can clear the neutral zone with conviction.
Rising open interest and long-heavy positioning among larger traders support the buyers' case, echoing renewed strength across the broader altcoin market.
That said, RENDER remains well below year-ago levels, and repeated failed attempts to clear resistance earlier in the wedge suggest sellers haven't fully stepped aside.
A move below $1.3845 would put the recovery on hold.
Key Risks and Analyst Take
Supply concentration is the standout risk, with whale wallets controlling nearly 96% of tokens; a meaningful move from these wallets could swing price quickly.
The steep one-year decline underlines RENDER's volatility, and no major fresh catalyst is currently dominating the setup, so this move looks technical and positioning-driven.
As per the CoinGabbar analyst desk, RENDER's break out of its multi-month wedge looks technically sound, and rising open interest paired with long-skewed positioning adds weight to the bullish case.
But the $1.5417 to $1.8807 neutral zone is doing a lot of work, and until price clears its upper end on real volume, this reads more as a recovery attempt than a confirmed reversal.
Final Take
This Render price prediction 2026 outlook shows RENDER clawing back ground after breaking out of a long consolidation wedge, with derivatives data leaning toward continuation.
Whether that becomes a sustained run toward $1.8807 and higher comes down to volume on the next resistance test, with $1.3845 and $1.2259 the key downside checkpoints if momentum fades.
Disclaimer: This article is for informational purposes only and is not financial or investment advice. Cryptocurrency markets are highly volatile; always do your own research before investing.

















