RENDER Price Prediction September 2026: Nvidia Boosts Breakout Hopes


This RENDER price prediction September 2026 arrives at a moment when the chart is quietly testing traders' patience.
A trendline that has driven the price lower since its all-time high has already seen a breakout attempt, and unlike so many failed bounces along the way down, this one has not been undone yet.
Price is holding, drifting, and slowly building toward something bigger without giving away which direction that something is.
Whether this is the calm before a real move or just another pause before more selling is exactly what this update digs into. Here's the full picture.
RENDER Price Today: Live Data and 24-Hour Change
RENDER is trading near $1.529 on the weekly chart.
Separate live data from CoinGlass puts the coin around $1.535, down close to 1.1% over the past 24 hours, with futures volume of $63.40 million against spot volume of $19.24 million and open interest at $56.34 million.
Market cap stands at $794.94 million on a circulating supply of 518.77 million RNDR against a total supply of 533.53 million and a max supply of 644.16. million, meaning close to 125 million tokens, roughly 19.5% of the eventual max supply, are still outside circulation.
Source: TradingView (RENDER/USDT perpetual, Binance, weekly chart) and CoinGlass, both accessed August 25, 2026, IST.
RENDER News: NVDA Earnings and the AI Compute Trade
An X post from exchange account Phemex, published roughly an hour before this piece, mapped out how AI-linked equities and crypto tokens tend to move together around big earnings events.
The post framed Nvidia's upcoming earnings as a signal worth watching for AI compute exposure, pointing directly at RENDER as the token tied to that theme, while separately linking Palantir-driven AI adoption sentiment to NEAR Protocol and Fetch.ai and Bitcoin to broader risk appetite across the market.
For a network built around decentralized GPU rendering and AI compute demand, this kind of framing puts RENDER coin price action squarely in the path of Nvidia earnings volatility this cycle, adding a fresh layer to the broader Render price prediction September 2026 conversation.
Source: X post by @Phemex_official, posted roughly 1 hour before this piece, August 25, 2026.
RENDER Holder Concentration Data
Holder concentration data from Solscan shows RENDER supply sitting fairly top-heavy.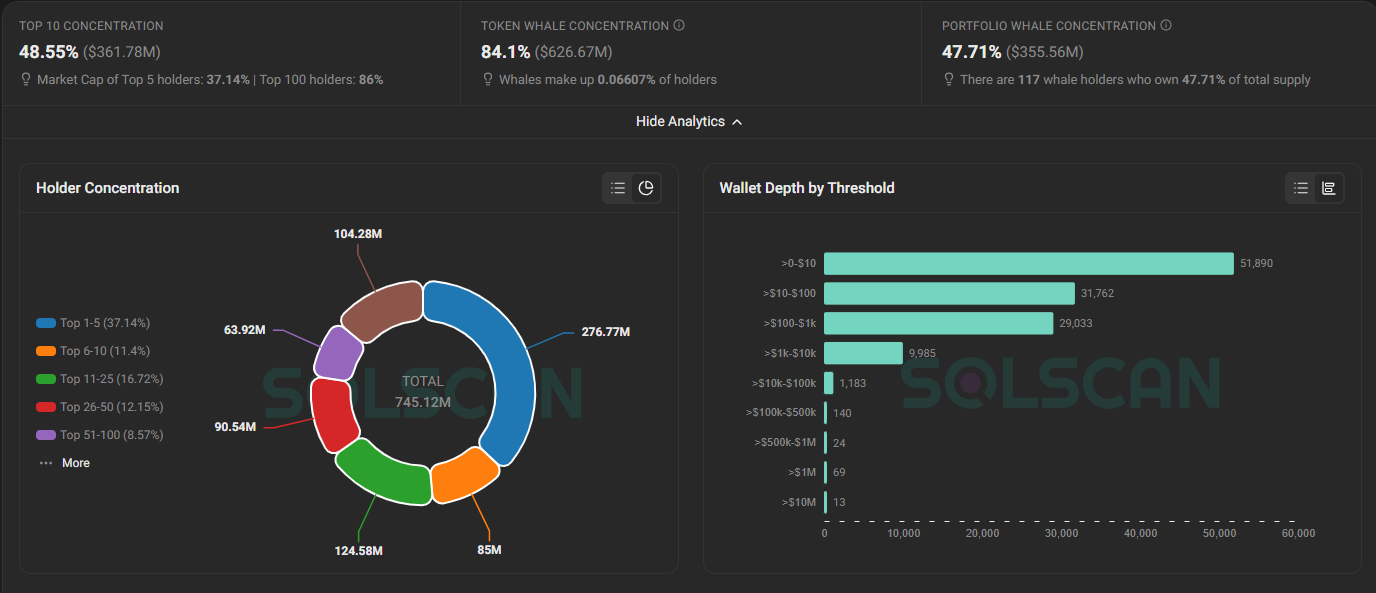
The top 10 holders control 48.55% of tracked supply, worth close to $361.78 million, while the top 100 holders combined account for around 86% of the total.
Whale wallets, just 82 addresses making up roughly 0.066% of all holders, hold about $626.67 million, translating to close to 84.1% of tracked market cap.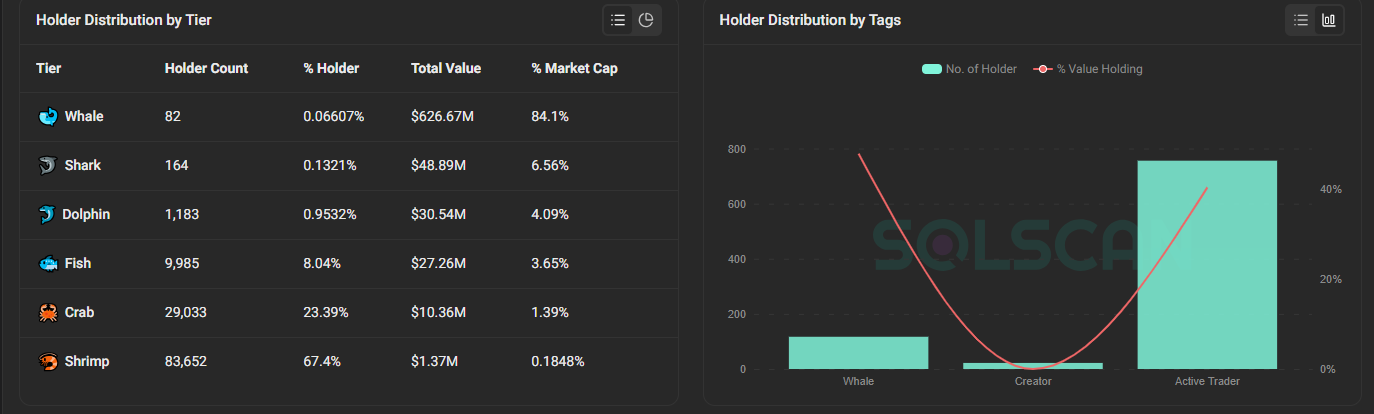
On the other end of the spectrum, more than 83,000 smaller shrimp-tier wallets make up over two thirds of all holders but represent barely above $1.37 million in combined value, a gap that highlights how concentrated ownership remains even as the holder base grows wider.
Source: Solscan holder analytics, accessed August 25, 2026.
Quick Take
CMP: $1.529
Weekly trigger: close above $2.720, opens $4.137, then $5.517
Weekly failure: close below $0.529 invalidates the bullish structure
Data as of August 25, 2026, IST
Short risk note: these levels come from the weekly chart and depend on confirmed weekly closes, not intraday wicks.
Leveraged positions around these zones carry liquidation risk if price whipsaws before a level is confirmed.
Render Technical Forecast September 2026
RENDER has been sliding along a descending trendline since its cycle high near $5.517, and the drop was not evenly paced.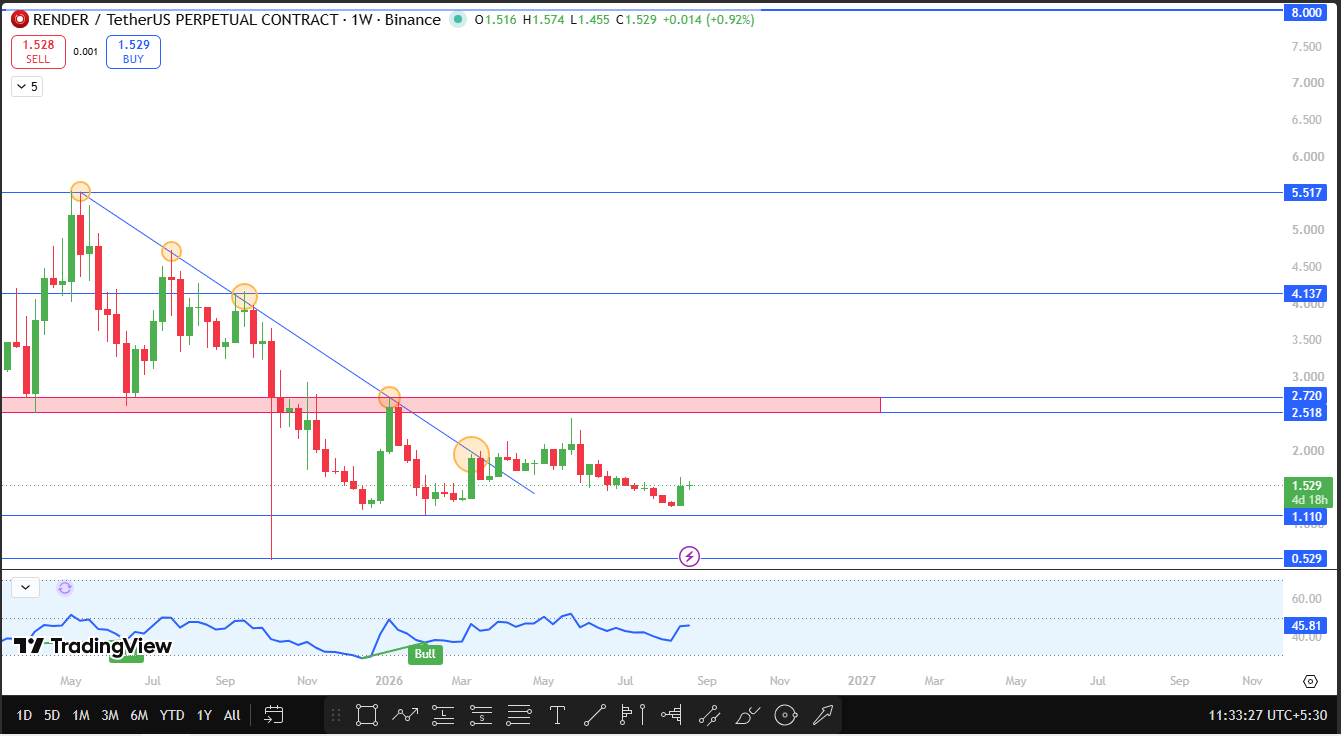
The steepest fall came at the second retest of that trendline, a sharp rejection that did more damage than any of the moves before or after it.
By the time price reached the fourth retest, the character of the decline had changed.
Instead of another hard rejection, RNDR pushed through the trendline in a genuine breakout, and unlike earlier false signals along this downtrend, that breakout has not failed since.
Since then, price has been sustaining rather than reversing outright, grinding lower at a much slower pace while it works through the old flip zone between $2.518 and $2.720, a range that used to act as support before price broke below it and now sits overhead as resistance.
The current structure looks like RNDR is quietly building toward a breakout attempt rather than committing to one just yet.
The chart's momentum indicator is currently reading near 45.81 with a bull tag showing, consistent with a market that has stabilized without yet confirming a strong reversal.
If RENDER breaks and closes a weekly candle above the $2.518 to $2.720 flip zone, a level roughly 65% to 78% above current price, it opens the door to $4.137 as the next resistance, sitting close to 170.57% above current price.
Beyond that, $5.517 stands out as the next major swing high, around 260.82% higher, with $8.000 marked as the major resistance further out, representing a move of roughly 423.16% from current levels if this RENDER breakout prediction September 2026 plays out in full.
On the downside, a weekly close below $0.529, about 65.40% under current price, would invalidate this bullish structure entirely, suggesting the trendline breakout has ultimately failed to hold.
Source: TradingView, RENDER/USDT perpetual chart, 1-week timeframe, Binance, captured August 25, 2026, IST.
RNDR Support and Resistance Levels to Watch
Level Type | Price | Change from CMP | Note |
Support | $0.529 | -65.40% | Weekly close below this invalidates the bullish setup. |
Support | $1.110 | -27.40% | Recent swing low, near-term support |
Resistance | $2.518-$2.720 | +64.68% to +77.89% | Old flip zone, former support now acting as resistance |
Resistance | $4.137 | +170.57% | First target after flip zone breakout |
Resistance | $5.517 | +260.82% | Prior swing high, second target |
Resistance | $8.000 | +423.16% | Major resistance |
RENDER Price Prediction: Bull, Base, and Bear Cases
The base case has RENDER continuing to grind slowly below the $2.518 to $2.720 flip zone through most of September, without a confirmed weekly close above that range or below $0.529.
The bull case activates on a weekly close above the flip zone, which opens a path toward $4.137 and eventually the $5.517 and $8.000 levels further out.
This RENDER technical analysis September 2026 case gets extra support from the AI compute narrative tied to Nvidia earnings, which could pull fresh attention and volume into RNDR if sentiment around AI-linked tokens turns positive.
The bear case needs a weekly close below $0.529, which would suggest the trendline breakout was a temporary pause in the broader downtrend rather than a genuine reversal.
Every one of these RNDR price target September 2026 scenarios depends on a confirmed weekly close, not a temporary wick through any level.
On-Chain and Fundamental Drivers
Render Network's core value proposition, decentralized GPU compute for rendering and increasingly for AI workloads, keeps pulling it into the broader AI token narrative whenever compute demand becomes a talking point across markets.
That positioning is a double-edged sword. It gives RNDR a fundamental story that goes beyond pure price speculation, but it also means the token tends to move on sentiment tied to companies like Nvidia rather than purely on its own network metrics.
The heavy concentration among whales and top-10 wallets adds another dimension worth watching.
With whale-tier addresses controlling the large majority of tracked value, large holder movements have the potential to influence price more than they might for a more evenly distributed token, something worth factoring into any RNDR price outlook September 2026.
September 2026 Catalysts
Nvidia's upcoming earnings report stands out as the most immediate catalyst, given how directly RENDER has been tied to the AI compute trade in recent commentary.
Beyond that, traders will likely be watching whether RNDR can build enough momentum to test the $2.518 to $2.720 flip zone, along with broader shifts in Bitcoin dominance and overall crypto market liquidity through the month.
Risks That Could Invalidate This Forecast
This bullish setup fails if RENDER cannot close a weekly candle above the $2.518 to $2.720 flip zone and fails more seriously if the price closes below $0.529, which would undo the breakout structure built since the fourth trendline retest.
Broader risks include a weak or disappointing Nvidia earnings print dragging AI-linked tokens lower, concentrated whale wallets exerting outsized influence on price, shifts in Bitcoin dominance, macro liquidity conditions, and general crypto market volatility, any of which could override RENDER's own chart structure regardless of where its levels sit.
Glossary
Flip zone: a price range that has switched roles between support and resistance, often rejecting price on the first retest after a breakdown
Descending trendline: a downward-sloping line connecting a series of lower highs, used to track a prevailing downtrend
Weekly close: the final traded price when a weekly candle finishes, used to confirm whether a breakout or breakdown is genuine
Open interest: the total number of outstanding futures or options contracts that have not yet been settled
Support: a price zone where buying pressure has previously stepped in
Resistance: a price zone where selling pressure has previously capped upside
Invalidation level: the price point at which a forecast scenario is considered incorrect
Whale concentration: the share of a token's total supply or value held by its largest wallet addresses
Disclaimer
This article is for informational purposes only and does not constitute financial advice. Cryptocurrency markets are highly volatile, and all price levels discussed are based on technical chart analysis, not a guarantee of future performance. Readers should conduct their own research before making any investment decisions.
Also read:

















