Sei Price Prediction September 2026: Next Breakout About to Begin?


$SEI is buzzing after a post claimed Sei Network surpassed $39M in 24h trading volume, and traders are watching whether this fresh interest can push the price out of its recent range.
This Sei price prediction September 2026 update looks at whether $SEI can hold above $0.04518, with $0.04812 as the level that would confirm the next leg up.
Market data was checked on August 26, 2026, at 1:34 IST.
$Sei Price Prediction September 2026 Today: Market Overview
Metric | Value |
Price | $0.04649 |
24h Change | -4.29% |
Market Cap | $346.49M |
Unlocked Market Cap | $346.49M |
FDV | $464.46M |
24h Volume | $28.73M |
Vol/Mkt Cap (24h) | 8.44% |
Total Supply | 10B $SEI |
Max Supply | 10B SEI |
Circulating Supply | 7.46B $SEI |
Source: Data from CoinMarketCap as of August 26, 2026, at 1:34 IST. Figures may vary slightly across other tracking websites.
Sei News Update: Volume Claim Doing the Rounds
A post from account criptoovar claimed $Sei Network surpassed $39M in 24h trading volume, tagging $SEI as one to watch.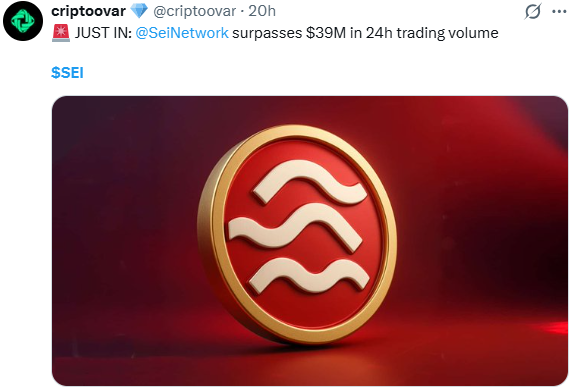
Source: Data From X
Note: This figure runs above the $28.73M shown on the market tracker, and CoinGabbar could not independently verify the exact source or timeframe used for the $39M number.
It is best treated as an unverified estimate rather than a confirmed data point until a primary source lines up with it.
Sei Price Prediction September 2026 Analysis: Chart Levels
Pair: SEI/USDT · Market: Spot (Crypto) · Exchange: OKX · Timeframe: 1D · Source: TradingView · Timestamp: August 26, 2026, 11:34 UTC+5:30
$SEI is trading at $0.04649, after breaking sharply out of the descending channel it had been sliding in since early July.
The breakout pushed the price up to $0.05137 before it cooled off into a tight pullback, and $SEI is now consolidating just above the EMA cluster.
RSI (14) sits at 59.89, a firm reading that shows momentum still favors buyers without being stretched.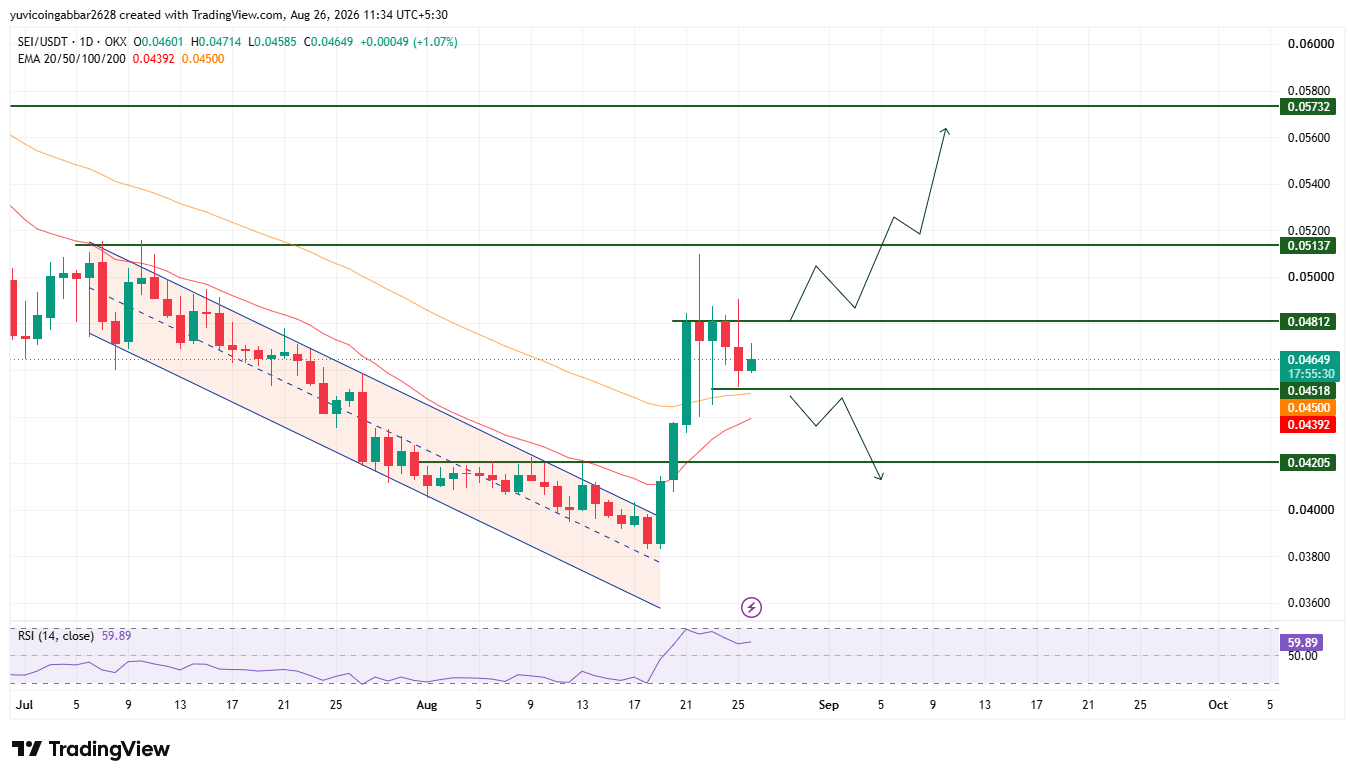
Sei Price Prediction September 2026: Key Levels
Level Type | Price |
Resistance 3 | $0.05732 |
Resistance 2 | $0.05137 |
Resistance 1 (nearest) | $0.04812 |
Immediate Price Reference | $0.04649 |
First Confirmed Support | $0.04518 |
Deeper Support | $0.04205 |
Sei Price Prediction September 2026: Bull, Base and Bear Cases
Bull case: Holding above the EMA cluster near $0.04392 to $0.04500 and clearing $0.04812 would confirm the breakout is extending, opening room toward $0.05137 and eventually $0.05732.
Base case: $SEI keeps chopping between $0.04518 and $0.04812 for now, digesting the recent breakout before committing to a clear direction either way.
Bear case: A close back below $0.04518 would put the breakout in doubt and expose $0.04205 as the next downside level.
Scenario | Trigger | Likely Outcome | Invalidation Point |
Bullish continuation | Close above $0.04812 | Move toward $0.05137 | Close back below $0.04649 |
Range-bound | Price stays $0.04518-$0.04812 | Sideways consolidation | Break of either boundary |
Bearish breakdown | Close below $0.04518 | Drop toward $0.04205 | Reclaim of $0.04518 |
Can $SEI Reach $0.05732?
$0.05732 is the highest resistance marked on the chart.
Reaching it would require $SEI to clear $0.04812 first, then break and hold above $0.05137, a multi-stage move rather than a single leg higher.
$Sei Price Prediction September 2026: Expert View
According to CoinGabbar analysts, the sharp channel breakout and firm RSI reading show real buying interest returned to $SEI, and the pullback since has stayed shallow so far.
The $0.04518 to $0.04812 zone is the key battleground: holding it keeps the breakout thesis alive, while losing it points back toward the prior downtrend.
Disclaimer: This piece is for informational purposes only and isn't financial advice. The levels and scenarios above are based on technical chart analysis and publicly available data at the time of writing, and crypto markets can move sharply within hours. It's worth doing independent research and considering your own risk tolerance before acting on any of the levels discussed here.

















