Zcash Price Prediction: Can ZEC Break Out After the ZecMap Update?


Zcash just added a new reason for people to actually spend ZEC. Thanks to a ZecMap integration, the token can now be used to buy real estate in five countries, book flights across 600 airlines, and purchase anonymous eSIMs, a real-world utility story rather than just a speculative one.
That update lands at an interesting moment for this Zcash Price Prediction: $ZEC's daily time frame is stuck inside a descending channel testing support.
While the 1-hour time frame is building an ascending channel of its own. Can the payments narrative give traders a reason to lean into the shorter-term recovery, or does the bigger daily structure still call the shots?
Why Are Traders Watching ZEC's New Payments Story?
Zcash's shielded-payments angle just got more tangible. Through ZecMap, ZEC can now be spent on real estate purchases in five countries, flights with 600 airlines, and anonymous eSIMs, with merchants able to sign up to accept ZEC directly.
That's a genuine expansion of what $ZEC can be used for, not a confirmed driver of price.
Traders have a new reason to pay attention to Zcash's private-payments case; whether that turns into sustained demand is still an open question the chart has to answer.
Are ZEC Derivatives Traders Convinced Yet?
Open interest has climbed to $817.27M, rebuilding after cooling from levels above $1.5B earlier in the year with renewed leveraged interest, though still well off the year's highs.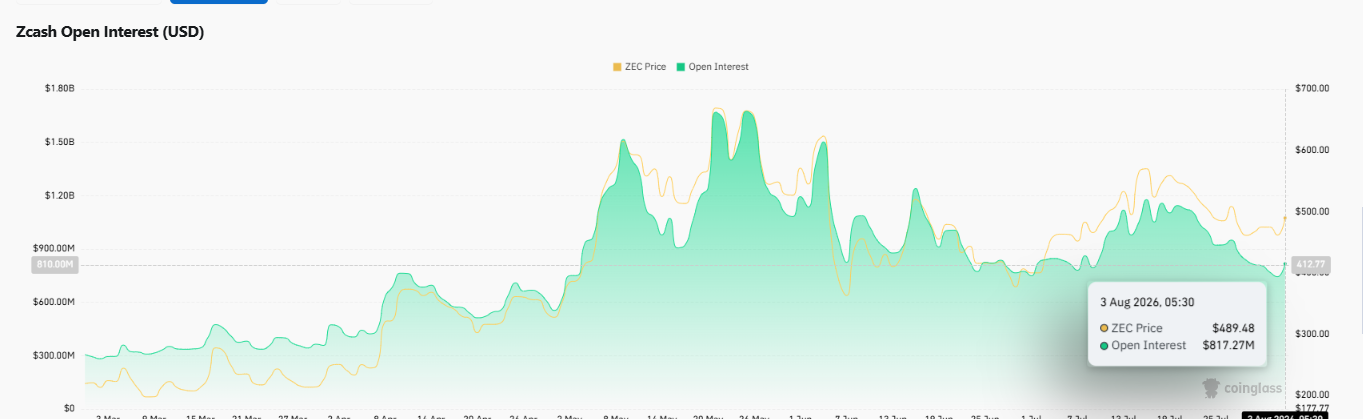
Positioning leans cautious at the account level: Binance's ZEC/USDT ratio is 0.6521, and OKX's is 0.92, both below 1.
Binance's top traders show the same account-level caution at 0.6477, but their position-weighted ratio jumps to 1.1953, meaning the biggest bets are net long even as smaller accounts hold back.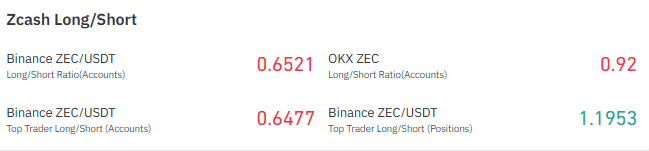
Liquidations tell a two-part story. Over 24 hours, $1.58M of the $2.15M in total liquidations came from shorts, a squeeze earlier in the session.
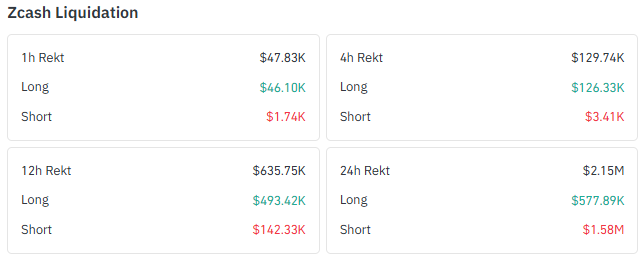
But the most recent hours flipped hard: the last 4 hours saw $126.33K in long liquidations against just $3.41K in shorts, and the past hour was almost entirely longs.
That's a market that squeezed shorts higher, then punished longs on the pullback.
Data source: coinglass
What Does ZEC's Recent Price Action Say?
$ZEC is roughly flat over 24 hours but down 6.55% over the past week.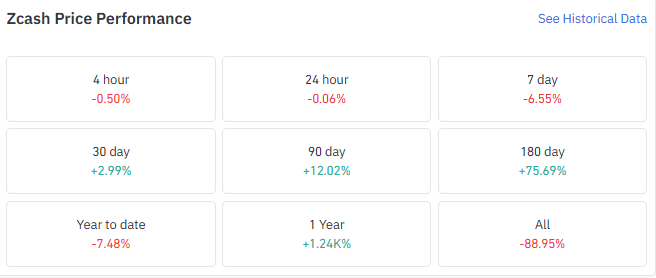
Zoom out and the picture flips positive: up 2.99% over 30 days, 12.02% over 90 days, and 75.69% over 180 days.
Year to date, though, $ZEC is still down 7.48%, a reminder that the broader crypto market outlook for $ZEC has been choppy even during a strong medium-term run.
Daily and 1-Hour Chart: Two Timeframes Pulling in Different Directions
On the daily chart, $ZEC trades around $472.57, inside a descending channel and testing support at $450.64. RSI reads 46.35, weak but not collapsing.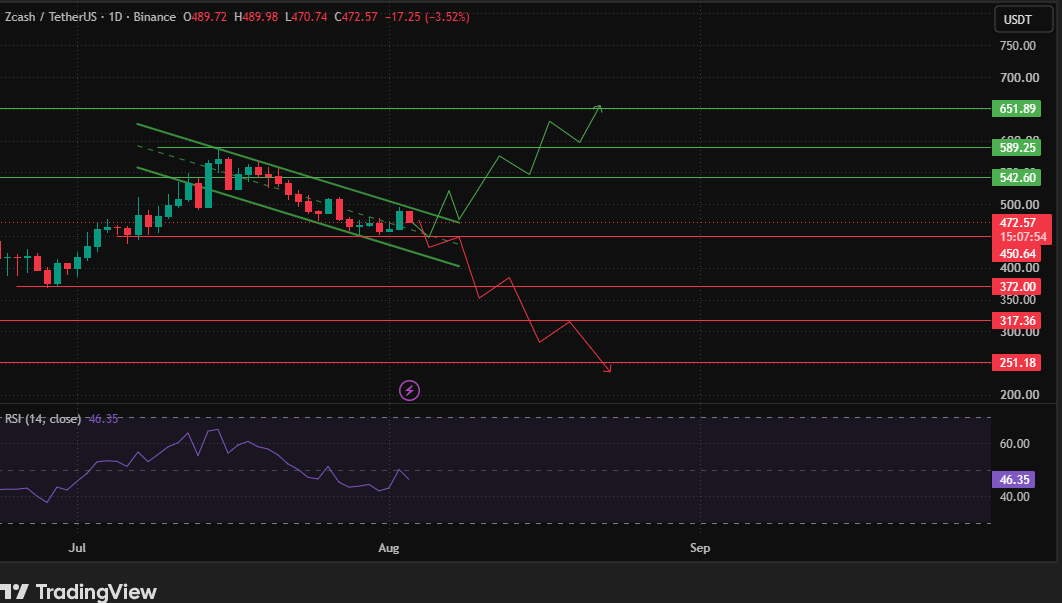
A break above the channel would open a path toward $542.60, then $589.25 and $651.89.
A loss of $450.64 instead would shift attention to $372.00, then $317.36 and $251.18.
The 1-hour chart tells a shorter-term, more constructive story. ZEC is building an ascending channel around $474.88, having recently found support within it.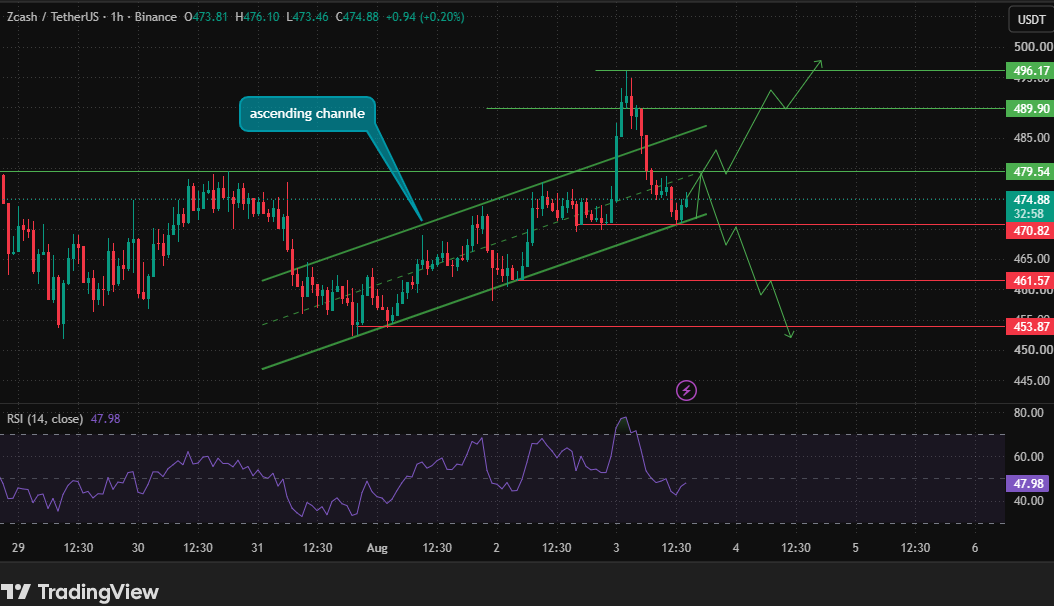
RSI sits at 47.98, still neutral. A break above $479.54 would clear the channel and open $489.90, then $496.17. Below that, $470.82, $461.57, and $453.87 are the levels that matter if the channel gives way.
This is where ZEC technical analysis carries more weight than either timeframe reads alone.
Data source: TradingView
Where Does That Leave ZEC's Sentiment?
The 1-hour ascending channel is a genuine short-term positive, and mixed derivatives positioning shows real two-sided interest, but the daily time frame descending channel is the higher-timeframe signal, and $ZEC hasn't broken out of it.
Until that channel breaks, the bigger picture stays cautious even as the payments narrative builds.
Zcash Price Prediction: Three Scenarios for ZEC
Scenario | Trigger | Price Outlook |
Bullish | ZEC breaks above its daily descending channel and clears $479.54 on the 1-hour chart. | Opens a path toward $542.60, then $589.25 and $651.89 on the daily chart, with $489.90 and $496.17 as the near-term 1-hour levels leading the way. |
Base Case | $ZEC holds above $450.64 on the daily chart, while the 1-hour range oscillates between $461.57 and $479.54. | Consolidation continues as the market tests whether the payments narrative and short-term structure can build enough momentum to challenge the daily channel. |
Bearish | $ZEC loses $450.64 on the daily chart, with the 1-hour chart breaking below $453.87. | Opens the door to $372.00, then $317.36 and $251.18 if the broader channel breakdown continues. |
One Payments Story, Two Charts Still Deciding
ZEC's new real-world spending use case gives Zcash a fresh reason to be in the conversation, but it doesn't resolve what's happening on the chart.
The daily descending channel and the 1-hour ascending channel are both live right now, and only one of them can be right.
$450.64 on the daily chart and $479.54 on the 1-hour chart are the levels that decide which side wins.
Until one breaks, this Zcash Price Prediction stays a wait-and-confirm setup rather than a directional call.
Disclaimer: This analysis is for informational purposes only and does not constitute financial advice. Cryptocurrency markets are volatile, and readers should conduct their own research before making investment decisions.


















