SPX6900 Price Prediction: $SPX Could Flip Into a Powerful Bull Run


SPX6900 launched in 2024 as a meme coin poking fun at the traditional stock market, positioning itself as an ironic alternative to the S&P 500 for crypto traders.
It's currently trading around $0.3848, up more than 20% on the day, with a market cap of $358.209M that puts it around the 115th largest cryptocurrency.
This SPX6900 price prediction leans on that breakout holding over the coming sessions.
Live Market Data
| Metric | Value |
| Price | $0.3848 |
| 24h Change | +20.1% |
| 24h Range | $0.3201 - $0.3849 |
| $358.209M | |
| Fully Diluted Valuation | $358.209M |
| 24h Trading Volume | $12.543M |
| Circulating Supply | 930.987M |
| Total Supply | 930.987M |
| Max Supply | 1B |
Source: $SPX market cap data taken from Coingecko, data as of Aug 20, 2026. Figures may vary slightly across other tracking websites.
Liquidation Snapshot
SPX6900's breakout came with $83.00K in total liquidations over the past 24 hours, and short sellers absorbed nearly all of it at $79.83K against just $3.17K in long liquidations, a clear sign the move caught bearish traders off guard.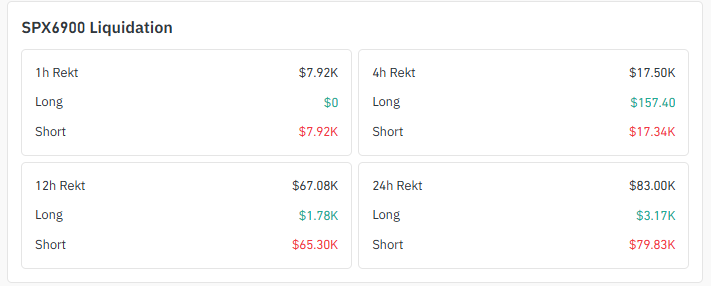
Source: Liquidation Data Taken From Coinglass.
The 12-hour window shows the same lopsided pattern, with $65.30K in short liquidations against only $1.78K in longs.
Even the shorter windows lean the same way, with the 4-hour window showing $17.34K in short liquidations against $157.40 in longs, and the 1-hour window showing shorts taking the entire $7.92K hit.
Exchange Volume
Binance leads SPX6900 futures activity with $10.57M in volume, followed by BingX at $6.83M and Bybit at $5.07M. 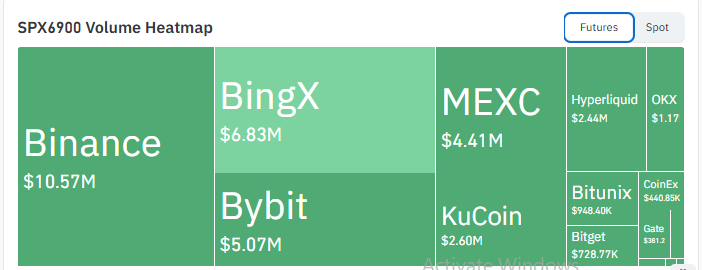
Source: Volume Heatmap Data Taken From Coinglass.
MEXC and KuCoin make up the next tier, while Hyperliquid, OKX, Bitunix, Bitget, CoinEx, and Gate contribute smaller but still meaningful slices of the total.
Key Takeaways
-
SPX6900 has broken out of the descending triangle it had been trading inside on the daily chart, and the price just posted a sharp move higher.
-
Current price sits at $0.3848, up 20.1% over the past 24 hours, inside a 24-hour range of $0.3201 to $0.3849.
-
Immediate resistance sits at $0.4280. A clean move above that level opens the path toward $0.4975.
-
Support below the current zone rests at $0.3401, with a deeper floor at $0.2779 if the breakout fails to hold.
-
Liquidation data shows short sellers taking the overwhelming brunt of the damage across nearly every timeframe, a sign the rally caught bearish positioning off guard, a bullish signal for this SPX6900 price prediction.
Technical Analysis
Daily Chart Analysis of $SPX
SPX6900 had been compressing lower inside a descending triangle on the daily chart, with a flat support line underneath and a falling resistance line squeezing down on top of it, based on TradingView data. 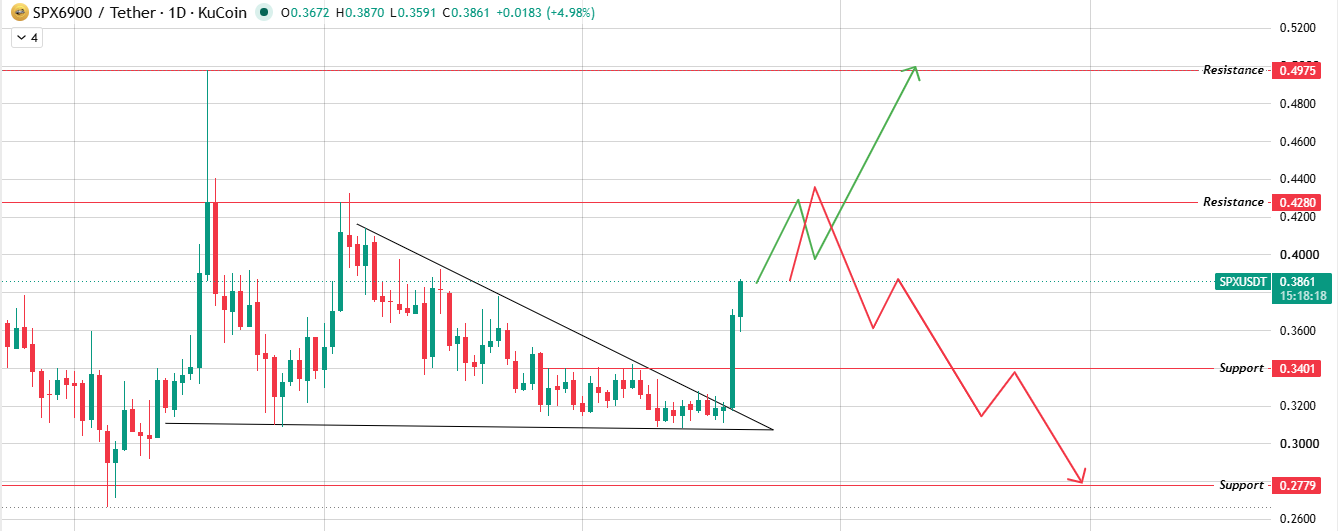
Source: Chart taken from TradingView.
That structure just broke. Price punched through the upper boundary of the triangle with a strong green candle, confirming the breakout.
From here, a hold above the breakout zone with continued volume support opens room toward $0.4280 first, then $0.4975 further out.
A failure to hold this move instead sends the price back down to retest $0.3401, with $0.2779 as the next floor if that level also gives way.
This is the key level to watch for this SPX6900 price prediction over the next few sessions.
Support and Resistance Levels
Level Type | Price |
Resistance 2 | $0.4975 |
Resistance 1 | $0.4280 |
Immediate Price Reference | $0.3861 |
First Support | $0.3401 |
Structural Floor | $0.2779 |
These levels for this SPX6900 price prediction are pulled directly off the daily chart, from the top resistance right down to the structural floor.
Bull, Base, and Bear Case
Scenario | Price level | Invalidation |
Bull | $0.4280 - $0.4975 | Fails to close above $0.4280 on strong volume |
Base | $0.3401 - $0.4280 | Price consolidates below resistance without a decisive push higher. |
Bear | $0.2779 or lower | The breakout zone at $0.3401 fails to hold, and the old triangle range reclaims price. |
These three scenarios anchor this spx6900 price prediction, weighted by whether the triangle breakout holds through the coming sessions.
Glossary
Descending Triangle: A chart pattern formed by a flat support line and a falling resistance line, typically resolved by a breakout in either direction.
Breakout: A price move above (or below) a defined chart boundary, often signaling a potential trend shift.
Liquidation: The forced closure of a leveraged trading position when losses exceed the trader's margin.
Resistance: A price level where selling pressure has historically been strong enough to stop further upward movement.
Support: A price level where buying pressure has historically been strong enough to halt further downward movement.
Market Cap: The total value of all circulating coins, calculated as price multiplied by circulating supply.
Circulating Supply: The number of coins currently available and trading in the market, as opposed to the total or max supply.
Methodology
All price levels and the triangle structure referenced in this spx6900 price prediction are derived directly from the 1D SPX/USDT chart on TradingView, cross-checked against live market data and Coinglass liquidation figures at the time of writing. No price levels are extrapolated beyond what the chart structure supports.
Disclaimer: This article is for informational purposes only and does not constitute financial, investment, or trading advice. Cryptocurrency markets are highly volatile, and prices can change rapidly. Always conduct your own research and consult a licensed financial advisor before making investment decisions.







.webp)








