Sui Price Prediction: Is $SUI About to Shock Crypto Markets?


Sui has positioned itself as one of the faster Layer-1 blockchains built around parallel transaction execution, and it has steadily built out a treasury and enterprise-facing ecosystem since its 2023 launch.
In this SUI price prediction, today $SUI trades at $0.6885, down 0.1% over the past day. The token has spent recent sessions compressing into a tight range rather than trending strongly in either direction.
With a circulating supply of 4.075 billion tokens against a max supply of 10 billion, $SUI still has more than half its total supply yet to enter circulation, which keeps dilution as a background factor for long-term holders.
This Sui price prediction looks at where $SUI stands today on the charts, not just where the levels point next.
$SUI Live Market Data
$SUI is currently trading at $0.6885, down 0.1% on the day. The 24-hour range has stayed tight, between $0.6727 and $0.6986.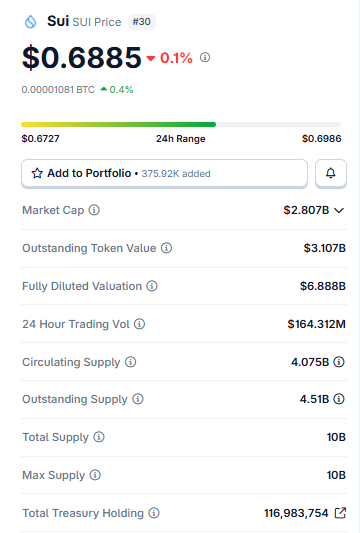
Source: $SUI have market data taken from live exchange feeds as of Aug 12, 2026. Figures may vary slightly across other tracking websites.
Market cap stands near $2.807B, with a fully diluted valuation of $6.888B given a max supply of 10B tokens against 4.075B circulating.
Trading volume over the last 24 hours came in at $164.312M, healthy for a token of this size.
Liquidation Data of $SUI
Leverage traders have been squeezed from both sides recently, though longs have taken the bigger hit over the last day.
Total liquidations hit $671.81K over 24 hours, with longs absorbing $543.42K against just $128.39K in shorts.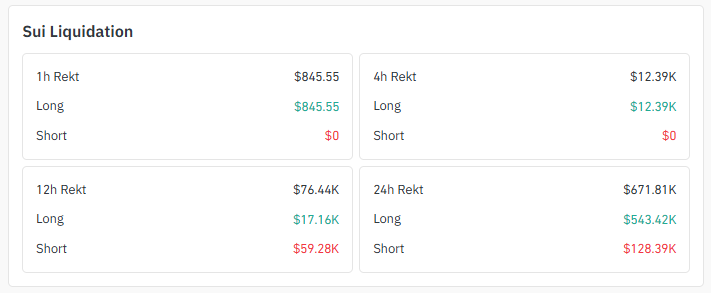
Source: liquidation data taken from Coinglass.
The 12-hour window flips the story somewhat, with $59.28K in short liquidations against only $17.16K on the long side.
That back-and-forth points to a choppy, two-sided market rather than one clear dominant trend heading into the current setup.
Exchange Volume of $SUI
Binance leads $Sui trading volume right now at $105.15M, followed closely by MEXC at $100.02M and WhiteBIT at $47.38M.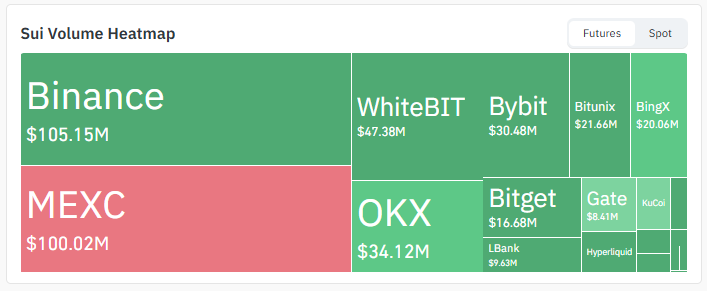
Source: Volume heatmap data taken from Coinglass.
OKX adds $34.12M, while Bybit, Bitunix, BingX, Bitget, Gate, and LBank contribute smaller but steady volume across the board.
Spread across this many venues, liquidity looks solid enough to support either breakout scenario without major slippage.
Sui News Today
Community watchers flagged a notable ecosystem update this week: the rollout of Tessera, a KYC-gated private settlement network built for business-to-business use.
Source: Data Taken From @Community_Sui, X Account.
The system is designed to let businesses settle invoices on-chain while keeping transaction details private and compliance-ready, an approach aimed squarely at enterprise adoption rather than retail speculation.
That kind of infrastructure push doesn't guarantee a price move, but it's the kind of fundamental tailwind that can support a bullish Sui price prediction if chart levels cooperate.
Key Takeaways
-
SUI is trading around $0.6885, down 0.1% in the last 24 hours.
-
On the 4H chart, price sits inside a symmetrical triangle, and a breakout above $0.7071 could open the door toward $0.7237.
-
The daily chart shows a consolidation box near multi-week lows, a classic setup before a bigger move.
-
Longs took the bigger hit lately, over $543K in long liquidations in the past 24 hours alone.
-
A Wolfe Wave pattern on the daily chart projects a level near $0.81 if the upper boundary breaks with volume.
Technical Analysis of $SUI
4-Hour Chart Analysis for Sui Price Prediction
The 4H chart has SUI boxed inside a symmetrical triangle.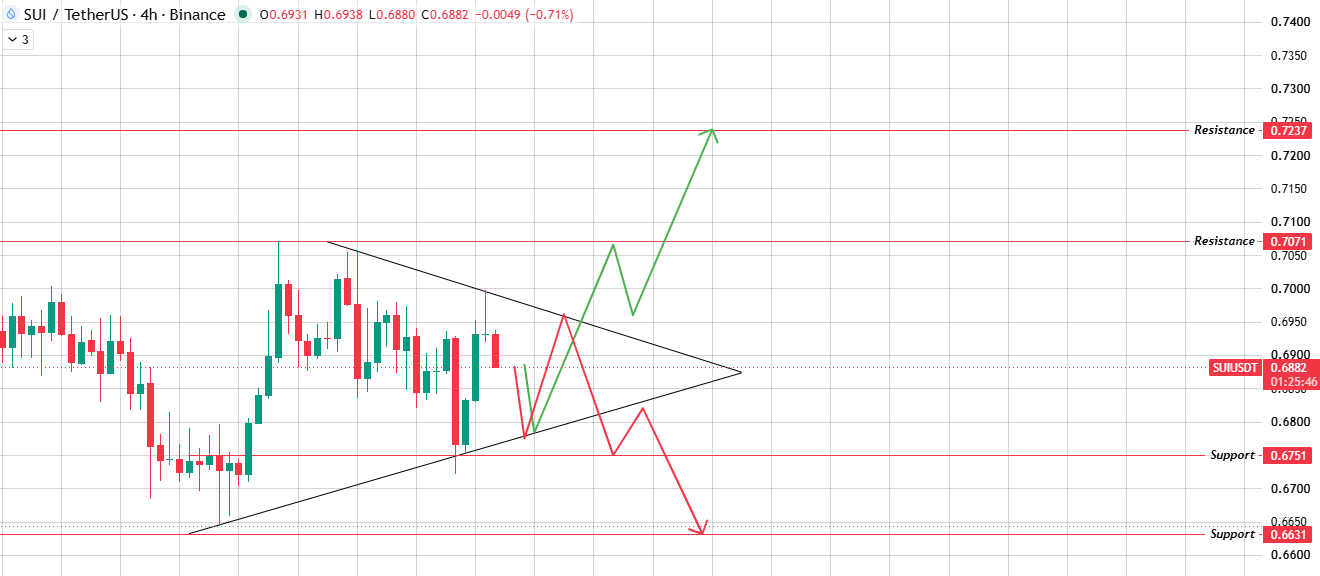
Source: Chart taken from TradingView.
If the price pushes to the upper boundary and breaks it with strength, the next stop is resistance at $0.7071, then $0.7237.
But if that boundary rejects price instead, expect a slide back to the lower boundary of the triangle.
A breakdown there, backed by volume, sends $SUI toward $0.6751 and then $0.6631.
Daily Chart Analysis for Sui Price Prediction
On the daily chart , price is boxed inside a red consolidation zone after pulling back from a prior swing high.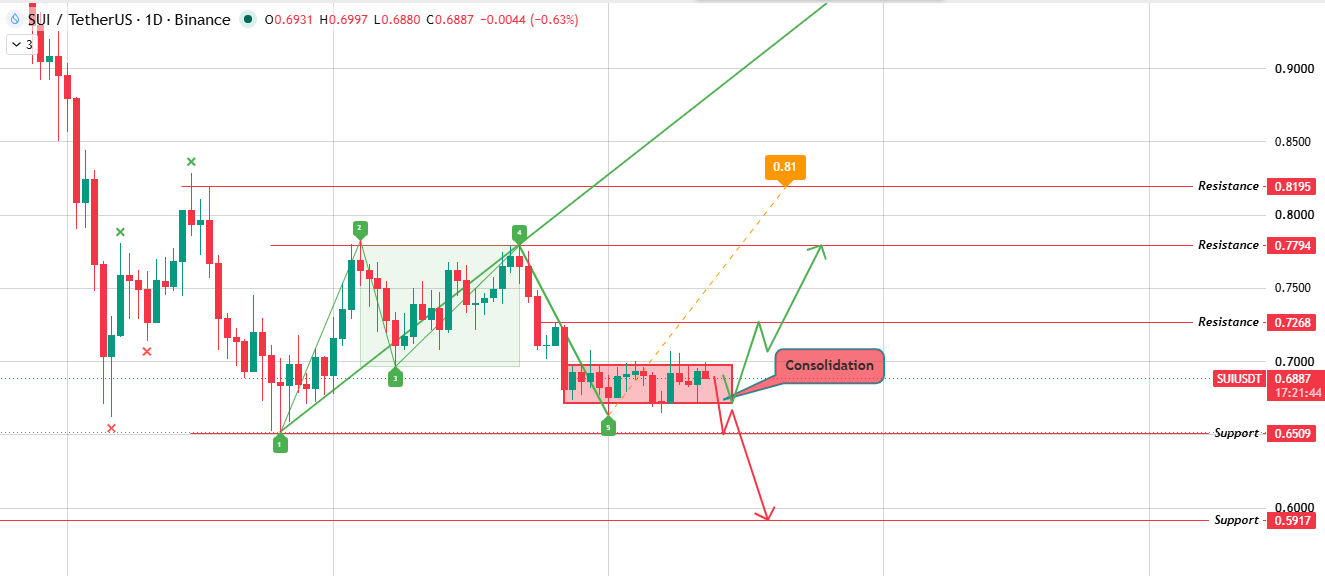
Source: Chart taken from TradingView.
A volume-backed break above the upper boundary of the box clears $0.7268 first, then $0.7794, and eventually $0.8195.
A break below the lower boundary flips things bearish, with $0.6509 and $0.5917 as next levels.
The Wolfe Wave pattern layered onto this chart projects a level near $0.81, specifically if the upper red boundary breaks with volume, aligning closely with the $0.7794–$0.8195 resistance cluster.
Both setups agree on one thing: SUI needs a decisive, volume-backed move soon to escape the current range.
Bull / Base / Bear Case
Glossary
Symmetrical Triangle: Two converging trendlines squeeze price into a narrowing range, usually right before a sharp move.
Consolidation Zone: A price range where a token trades sideways for an extended period without a clear trend, often before a bigger breakout or breakdown.
Wolfe Wave: A five-wave chart pattern used to project a future price Levels based on the structure of prior swing highs and lows.
Liquidation: This happens when an exchange forcibly closes a leveraged position because the trader ran out of margin.
Support Zone: Think of it as a price floor where buying pressure has historically stepped in.
Resistance Level: The opposite of support, a ceiling where selling pressure tends to cap upward moves.
Methodology
Levels used in this Sui price prediction come directly from chart data on the 4H and 1D timeframes.
Liquidation and volume figures are sourced from Coinglass. No price levels are extrapolated beyond what appears on the charts.
Disclaimer: This article is for informational purposes only and should not be treated as financial advice. Cryptocurrency markets are highly volatile, and prices can change quickly. Always do your own research and consult a financial advisor before making investment decisions.
Also read:

















