Will Bitcoin Price Hit $50K After Rejection From $81K Resistance?


Bitcoin Price Forecast: BTC Struggles Near $81K After Failed Breakout
Bitcoin price prediction models have turned more cautious this week. BTC touched about $81,200 on Aug. 25 before sellers pushed it back under $80,000.
This pullback comes at a tricky moment. Bitcoin is up nearly 25% in just ten days, one of its strongest short-term runs this year. Yet the crowd has not fully jumped back in, and some data points to a shaky setup ahead.
Below, we break down the charts, the on-chain data, and what traders are watching next.
What Is Bitcoin's Price Doing Right Now?
Bitcoin is trading around $79,535 as of the latest data. That's a small daily gain of about 0.74%.
The bigger story is the ten-day move. Price ran from roughly $62,800 on Aug. 16 to about $78,900 on Aug. 26. That's the sharpest short-term climb of the year so far.
But the rejection near $81,200 shows sellers are still active at that level. BTC has not managed a daily close above $81,000 yet.
Metric | Value | Change |
BTC Price | $79,535.80 | +0.74% |
Futures Volume (24h) | $62.01B | -13.16% |
Open Interest | $55.47B | -0.52% |
Options Volume | $3.53B | -15.25% |
Options Open Interest | $43.03B | +1.92% |
Long/Short Ratio (24h) | 1.0454 | Slightly bullish |
24h Liquidations | $72.35M | Short: $42.95M / Long: $29.40M |
Why Did Bitcoin Get Rejected at $81,000?
Derivatives positioning is elevated right now. That means leveraged bets are stacked up near current price levels, which raises the odds of sharp swings.
Futures volume dropped over 13% while open interest slipped slightly. This suggests some traders are stepping back after the rally, not adding fresh size.
The 3-day chart tells a longer story too. Bitcoin has formed a pattern of lower highs and lower lows since peaking near $97,000. It dropped to $60,000, bounced to $83,000, fell to $57,000, and now sits near this latest $81,000 rejection point.
If that structure holds, some analysts warn BTC could retest the $50,000 zone by November. A close above $83,000 would be needed to break that bearish pattern.
Is the Bitcoin Bull Market Already Starting?
Not everyone reads the charts as bearish. CryptoQuant data shows Bitcoin's Bull Score jumped from 30 to 80 in just one week, the most bullish reading since Oct. 6, 2025.
Eight out of ten indicators tracked by CryptoQuant are now flashing bullish. Spot demand is growing at its fastest monthly pace since late December.
Spot and futures demand are also rising together for the first time since early October 2025. CryptoQuant describes this as the early stage of a new bull market, though it says a confirmed close above the 365-day moving average near $83,000 is still required.
There's also a historical angle. Some analysts point out that if the current bottom holds, it would be the first time in Bitcoin's history that a bottom formed without sweeping either the Realized Price or the Long-Term Holder Realized Price, two levels BTC has touched in every past cycle bottom.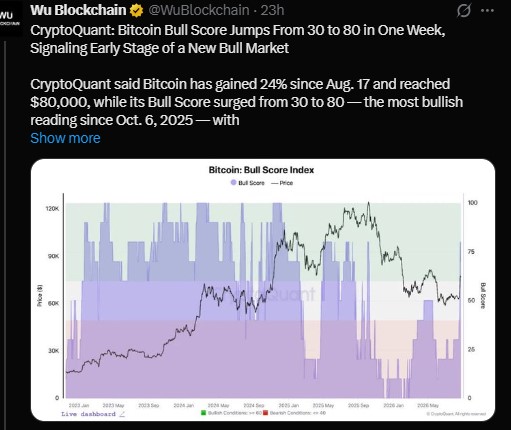
Why Hasn't Retail Bought Into This Bitcoin Rally?
This is one of the more unusual signals right now. Despite the 25% ten-day rally, sentiment data shows the crowd has stayed on the sidelines.
Weighted sentiment turned negative again, sitting around -0.023, the first negative reading since the rally started. The 7-day average sentiment is only around +0.009, far from anything resembling euphoria.
The loudest sentiment spike actually came on Aug. 19, at +0.054, tied to Treasury-related news. That excitement has faded even as price kept climbing.
In simple terms, this rally has mostly moved without heavy retail participation so far.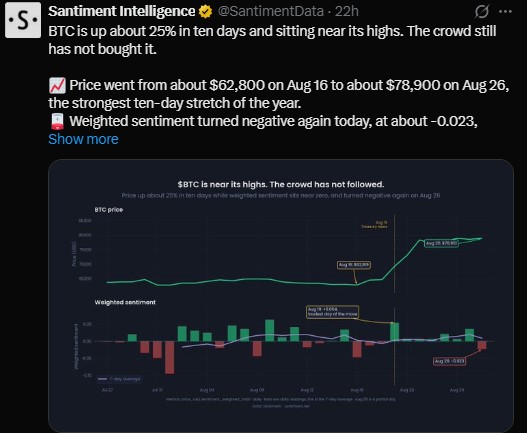
Are Bitcoin ETF Inflows Still Supporting the Price?
Yes, and this has been one of the more consistent bright spots. Spot Bitcoin ETFs saw their eighth straight day of net inflows, with $232 million added on Aug. 26 alone, according to SoSoValue data cited by Wu Blockchain.
Seven to eight consecutive sessions of inflows show steady institutional demand, even while retail sentiment lags behind.
Is the US Government Selling Bitcoin Again?
A wallet tied to the US Government's FTX/Alameda seized funds moved 24.41 BTC, worth about $1.92 million, roughly eight hours before this report.
This isn't a huge amount on its own. But if larger transfers follow from these government-linked wallets, it could add short-term selling pressure to the market.
Separately, whale wallets realized a record $614 million in profits on Aug. 20. Rising exchange inflows for BTC, ETH, and XRP also point to some investors preparing to sell into strength.
What Does the Long-Term Bitcoin Chart Show?
Zooming out helps put this pullback in context. Bitcoin's daily chart since 2023 shows a clear pattern of higher lows, moving from a base near $24,000 up through $35,000 and $51,000 zones before reaching an all-time high close to $125,000.
The current price near $78,728 to $80,000 sits inside a green support zone on that chart, similar in structure to the $51,000 zone that held during the last major pullback.
Chart watchers following this multi-year trend describe the broader move as still intact, even after the recent rejection at resistance.
That longer-term view is one reason some traders remain patient despite the short-term chop, even as others focus on the more bearish 3-day pattern described above.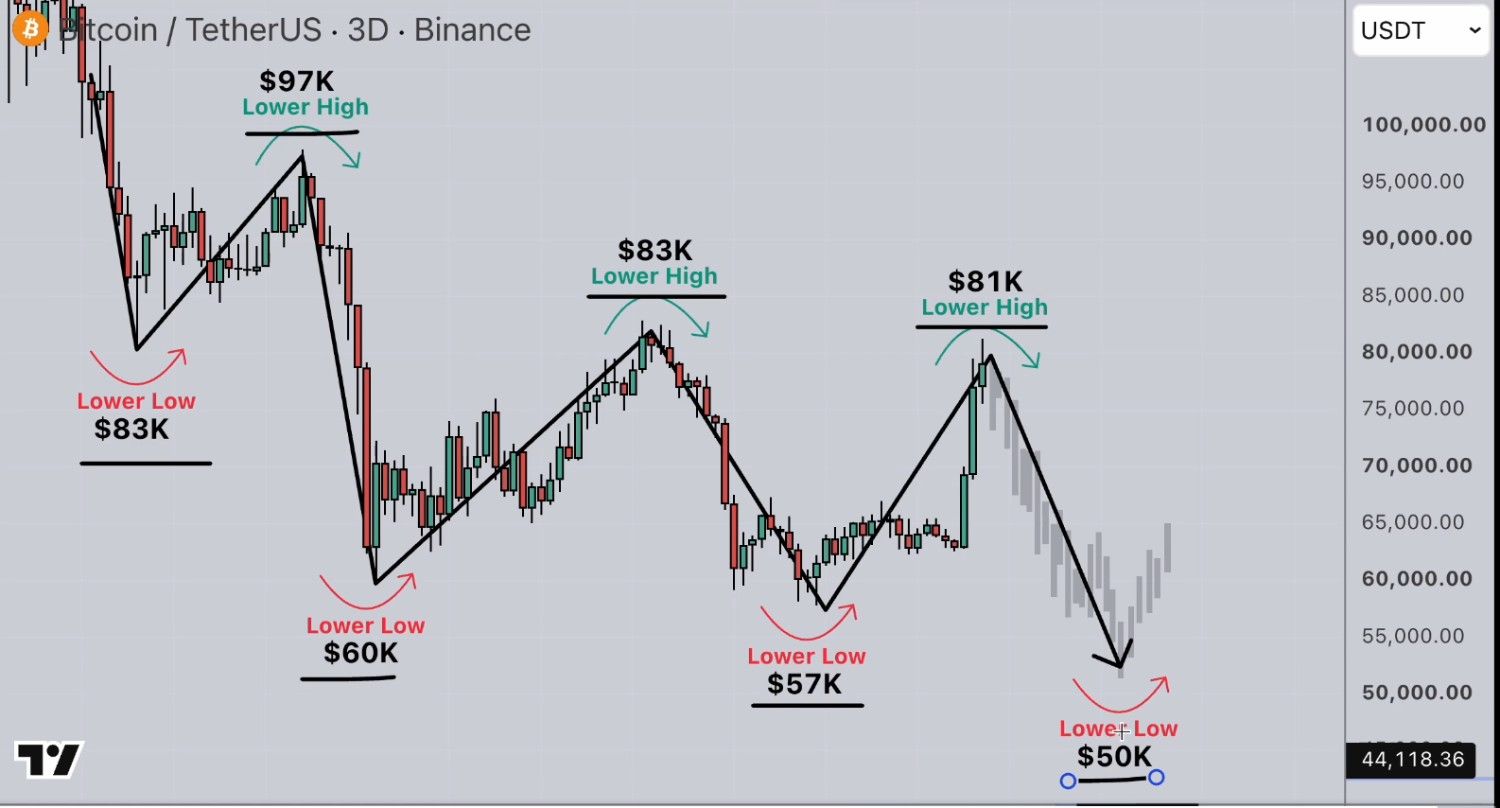
Bitcoin Price Prediction: What Are the Key Levels to Watch?
Resistance: $81,000 to $83,000. A confirmed close above this zone is needed to weaken the bearish structure and open the door to new highs.
Support: $78,900 to $80,000 in the near term. A deeper breakdown could bring $57,000 to $60,000 back into play, and some traders see $50,000 as a downside target if $83,000 fails to break.
Traders' unrealized profit margin has climbed to 20.5%, the highest since June 2025. That's often a level where profit-taking increases, adding another layer of near-term risk.
The Bottom Line
Bitcoin sits at a genuine crossroads. On one side, ETF inflows keep flowing, the CryptoQuant Bull Score has jumped sharply, and this could be an early bull market setup that hasn't required a historical bottom sweep.
On the other side, the price has been rejected at resistance, retail sentiment hasn't confirmed the move, and a bearish lower-high pattern is still technically intact.
Whether Bitcoin builds on this rally or slides back toward the mid-$50,000s likely depends on whether bulls can close firmly above $83,000 in the coming weeks.
Disclaimer: This article is for informational purposes only and does not constitute financial, investment, or trading advice. Always conduct your own research and consult a licensed financial advisor before making any investment decisions. Past performance is not indicative of future results.
Also read:

















