XRP News Today: Whale Activity and Leverage Ratio Hit January High

XRP is down 4.61% today, August 26, trading near $1.41 at the time of writing. The drop follows a wider pullback across crypto, with Bitcoin and Ethereum also slipping.
The token is now testing support close to its 200-week EMA. In the latest XRP news today, whale transfers to Binance have jumped to their highest level in four months, and derivatives data shows a mixed picture for traders watching the XRP price.
XRP Price Today: What Is the XRP Price Doing Right Now?
At the time of writing, the XRP price today sits around $1.4121, down roughly 4.9% over the past day, based on live exchange data.
Bitcoin sits near $78,380 and Ethereum near $2,446, so the pullback is not isolated to one token. Bitcoin had briefly topped $80,000 overnight before slipping back under that mark, and Ethereum and XRP followed with mild pullbacks of their own.
Part of the move ties back to rising bets that the Federal Reserve could raise rates in September, an unusual signal during what had been a strong rally. Markets are also watching today's US inflation print for the next cue.
XRP Market Cap and Supply Data
XRP's market cap stands at $88.24 billion, with a circulating supply of 62.74 billion tokens out of a total supply of 99.98 billion and a hard max supply of 100 billion.
Spot volume over the past 24 hours came in at $1.21 billion, smaller than the futures market, which shows most of the recent action has come from leveraged trading rather than direct token purchases.
How Bad Are Crypto Liquidations Right Now?
Nearly 79,000 traders were liquidated across the market in the past 24 hours, and total liquidations reached $323.90 million, with longs taking the bigger hit at $267.39 million against $56.50 million in shorts.
Bitcoin led the liquidation heatmap at $109.82 million, followed by Ethereum at $66.42 million. XRP came in lower at $16.77 million on the same heatmap. The single largest liquidation order hit on Binance, a $11.91 million BTC/USDT position.
Losses built up fast. The market went from $2.21 million in rekt positions over one hour to $11.82 million over four hours and $156.02 million over twelve hours before landing at the $323.90 million 24-hour figure.
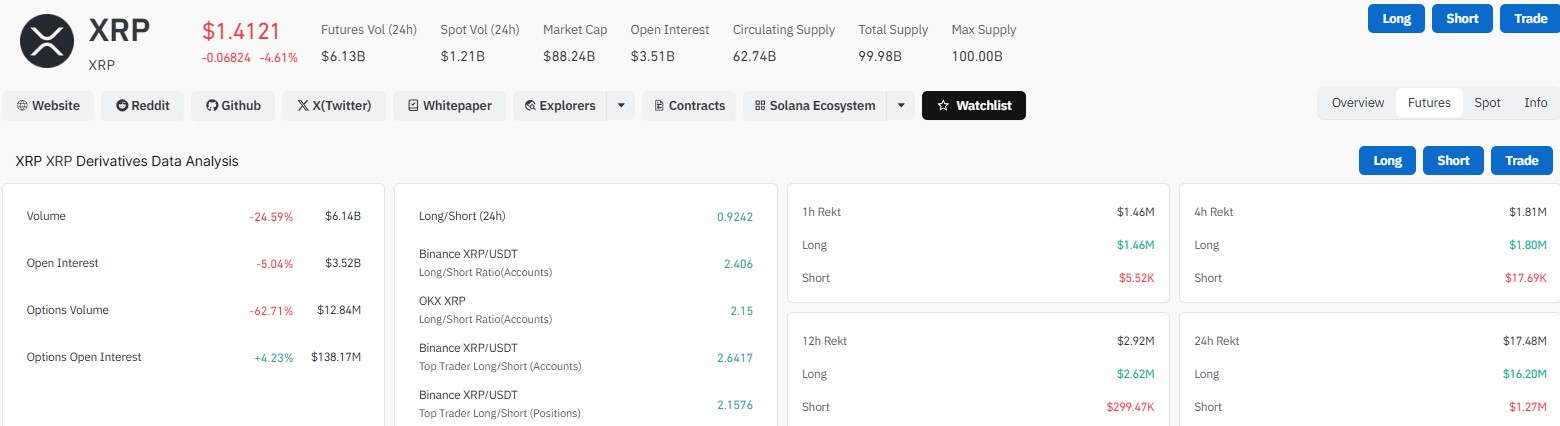
XRP's own derivatives desk tells a similar story on a smaller scale. Its 24-hour liquidations reached $17.48 million, with $16.20 million from long positions and just $1.27 million from shorts, up from $2.92 million total over the prior 12 hours.
Latest XRP News: Whale Activity, Leverage, and ETF Flows
Here is the $XRP latest news shaping sentiment around the token this week.
Why Are XRP Whales Sending Coins to Binance?
Large holders have been moving coins onto Binance at a fast pace. Daily whale inflow spiked to more than $240 million around August 19 and 20, the biggest single-day jump on record since February, according to CryptoQuant data shared by crypto trader Xaif Crypto.
Big deposits to exchanges often mean holders are getting ready to sell, though it can also reflect repositioning ahead of volatility. Either way, the size of the move stands out against the past several months of quieter flows.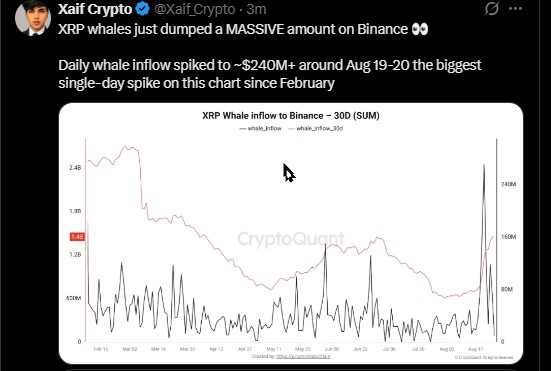
Network activity has also jumped. Active addresses climbed 654.71%, from 47,180 to 356,070, a sign that far more wallets are interacting with the network right now. That kind of spike usually comes with sharper price swings in both directions.
Is Rising XRP Leverage a Warning Sign?
XRP's estimated leverage ratio on Binance has climbed to about 0.213, the highest level since January, according to CryptoQuant analyst Arab Chain, as shared by BSCN.
Higher leverage means traders are opening bigger positions using borrowed funds. That can push prices further in a rally, but it also raises the odds of fast liquidations if the market turns.
Leverage stayed fairly calm through most of 2026 before this recent climb, so the shift is a change worth watching rather than a one-off blip.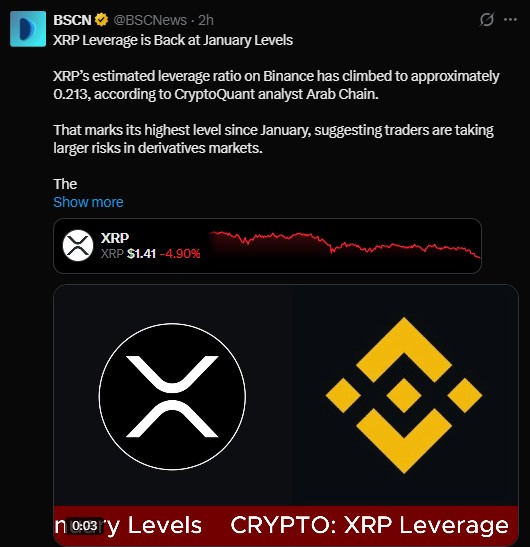
What Do XRP ETF Inflows Show?
Not all the recent data points to caution. $XRP ETFs pulled in $23.87 million on August 25, the strongest single-day inflow since May 2026, according to SoSoValue.
That extended a run of six straight days of inflows dating back to August 18, and monthly totals have reached their highest point since May as well.
Goldman Sachs reported roughly $86.5 million in exposure spread across five products, while Wells Fargo disclosed about $9.18 million. Institutional demand, in other words, has not backed off even as the price cools.
XRP Derivatives Data: What Are Traders Doing?
Futures volume has fallen 24.59% to $6.14 billion, and open interest is down 5.04% to $3.52 billion, pointing to some traders stepping back from the market.
Options volume dropped 62.71% to $12.84 million, but options open interest rose 42.23% to $138.17 million, so longer-term bets have not disappeared.
The 24-hour long/short ratio sits at 0.9242, a slightly bearish tilt overall. Still, major exchanges tell a different story.
Metric | Value | Change |
Price | $1.4121 | -4.61% (24h) |
Futures Volume (24h) | $6.14B | -24.59% |
Open Interest | $3.52B | -5.04% |
Options Volume | $12.84M | -62.71% |
Options Open Interest | $138.17M | +42.23% |
Long/Short Ratio (24h) | 0.9242 | Slightly bearish |
Total Liquidations (24h) | $17.48M | $16.20M long / $1.27M short |
XRP Price Forecast: Key Levels to Watch
On the hourly chart, the price has been stuck between $1.55 and $1.43 after last week's rally. That range has since been broken to the downside.
The token now trades under both the 20-hour EMA at $1.44 and the 50-hour EMA at $1.46, and it looks to be heading toward the 200-hour EMA near $1.35. The hourly RSI sits near 29.30, in oversold territory, which points to weak short-term momentum without being extreme.
On the weekly chart, the picture looks more constructive. The price broke a long descending trendline that had held since July 2025, and last week the price jumped 70% off a base near $1.00 before touching a high of $1.70.
That rally ran into resistance at the 50-week and 100-week EMAs. The price is now hovering near the 200-week EMA support around $1.37, and the weekly RSI is drifting toward the 50 level, a sign momentum is cooling rather than reversing outright.
If the price holds the $1.35 to $1.37 zone, the weekly structure still favors buyers over the medium term. A close below that band on high volume would open the door to a deeper pullback toward the $1.00 base formed earlier this year.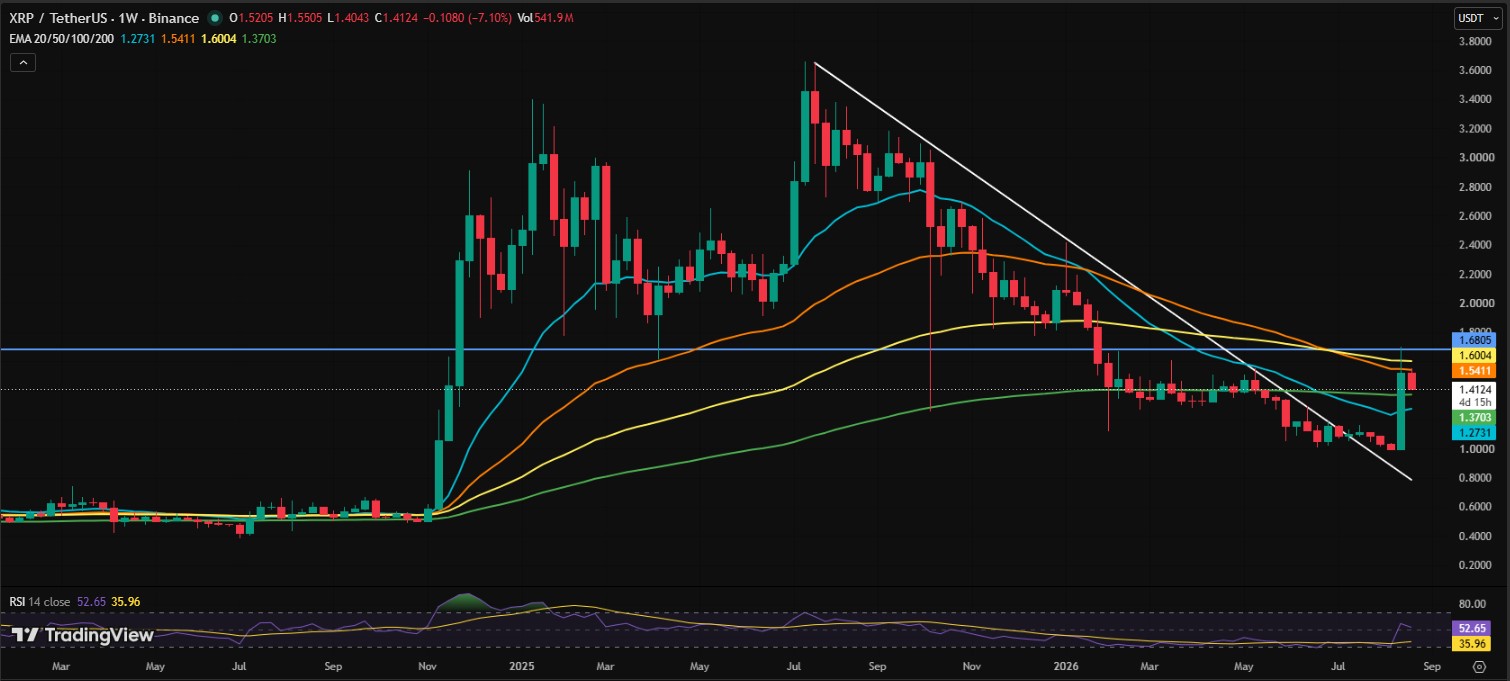
Final XRP Price Prediction: What's Next for the $XRP Price?
The token sits at a crossroads. Whale deposits, rising leverage, and heavy long liquidations point to short-term caution, while steady ETF inflows and a broken weekly downtrend suggest the bigger picture has not turned bearish.
Traders will likely keep an eye on whether the price can defend the 200-week EMA near $1.37, and whether open interest and long positioning recover in the days ahead. For now, the XRP price prediction leans on chart structure rather than headlines, so these levels matter more than short-term noise.
Disclaimer
This article is for informational purposes only and does not constitute financial, investment, or trading advice. Cryptocurrency markets are highly volatile, and prices can change quickly. Always do your own research and consult a licensed financial advisor before making investment decisions. Past performance is not indicative of future results.

















