Aave Price Prediction: AAVE Eyes an Explosive Breakout Run to $200


Aave launched in 2020 as one of the earliest and largest decentralized lending protocols in DeFi, letting users lend and borrow crypto assets without a middleman, and it remains one of the most closely tracked names in the space.
$AAVE currently trades at $124.95, down 3.4% on the day.
This Aave price prediction looks at where AAVE could head next after a sharp drop followed by a quick recovery, with price now hovering back near the same zone it fell from.
Price Today: Live Data and 24-Hour Change
Metric | Value |
Price | $124.95 |
24H Change | -3.4% |
24H Range | $124.83 - $130.72 |
Market Cap | $1.928B |
Fully Diluted Valuation | $1.999B |
24H Trading Volume | $251.965M |
Total Value Locked (TVL) | $17.894B |
Circulating Supply | 15.424M |
Total Supply | 16M |
Max Supply | 16M |
Source: Market data taken from CoinGecko, data as of Aug 26, 2026 (UTC). Figures may vary slightly across other tracking websites.
Liquidation Snapshot
Liquidations have leaned heavily toward long positions across every recent window: $106.27K over the past hour, all of it long, followed by $108.32K over 4 hours and $137.17K over 12 hours, again dominated by long liquidations.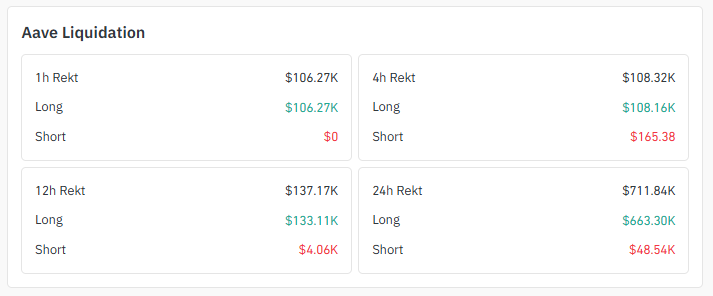
Source: Liquidation Data Taken From Coinglass.
Over the past 24 hours, total liquidations reached $711.84K, with $663.30K coming from longs against just $48.54K from shorts.
That imbalance lines up with the sharp move below the ascending channel, suggesting leveraged longs were the ones caught out during the sweep, which can sometimes clear the way for a cleaner bounce once forced selling is exhausted.
Exchange Volume Distribution
Futures trading volume for $AAVE is heavily concentrated on Binance, which handles roughly $109.95M, well ahead of OKX at $48.04M and BingX at $47.75M.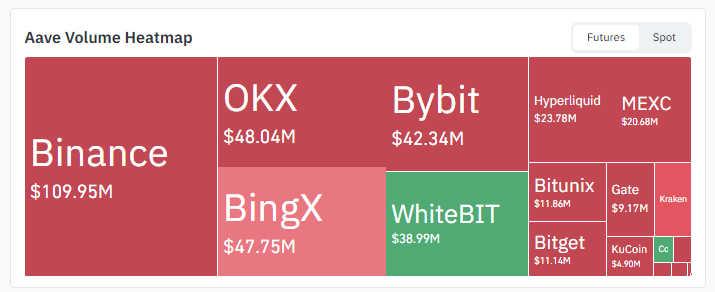
Source: Volume Heatmap Data Taken From Coinglass.
Bybit adds another $42.34M, with WhiteBIT, Hyperliquid, and MEXC each contributing meaningful volume in the $20M to $39M range, while smaller venues like Bitunix, Gate, Bitget, and KuCoin round out the rest.
This spread suggests $AAVE's futures activity is not overly reliant on a single venue, which tends to support more orderly price discovery during volatile sessions.
Holder and Whale Distribution
Whale wallets, defined as the largest holders, make up just 0.36% of all $AAVE addresses but control 92.02% of the market cap, with the top 5 wallets alone accounting for 32.10% and the top 10 for 42.93%.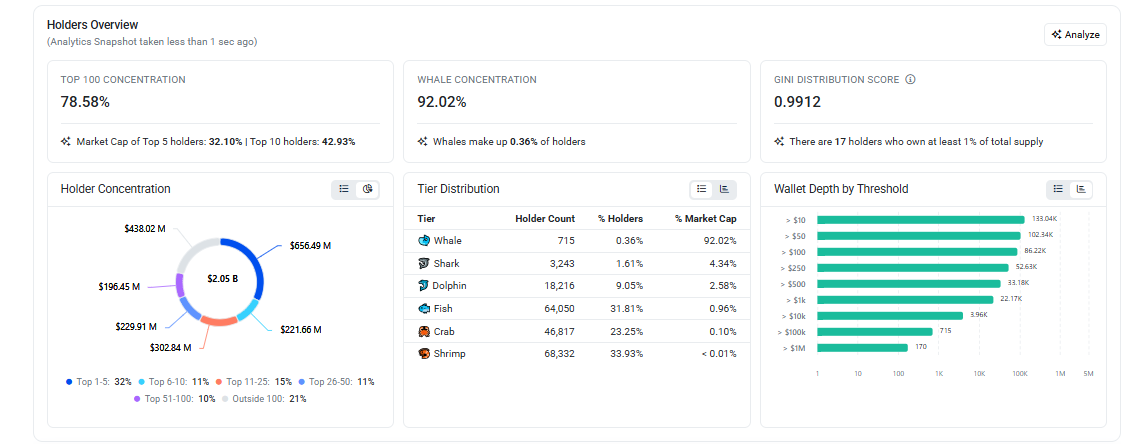
Source: Aave Holder Data Taken From Etherscan.
The Gini distribution score sits at 0.9912, reflecting extremely concentrated ownership, and 17 wallets each hold at least 1% of total supply.
Retail-sized wallets look very different: shrimp and crab tier holders make up more than half of all addresses but together control well under 1% of market cap, a common pattern for established DeFi tokens but still worth weighing here.
Key Takeaways
$AAVE trades at $124.95, down 3.4% on the day, after a daily candle that opened at $126.61 and closed at $124.96, down 1.30% for the session.
The daily chart shows $AAVE breaking below its ascending channel in what looks like a liquidity sweep, followed by a sharp bounce, and the price is now retesting that support zone.
A bounce with volume from here opens a path toward $145.69, then $180.51, and $202.91 further out for this Aave price prediction.
If the $116.60 support cannot hold, the price is likely to slide down to retest the rising trendline near $102.20, and a volume-backed bounce from there still keeps the bullish structure alive.
Whale wallets control 92.02% of the market cap despite making up just 0.36% of holders, a concentration level worth factoring into any Aave price prediction right now.
Daily Chart Analysis
$AAVE spent weeks climbing inside an ascending channel on the daily chart before breaking below the channel's lower boundary, a move that looked more like a liquidity sweep than a genuine trend reversal given how sharply price bounced right back.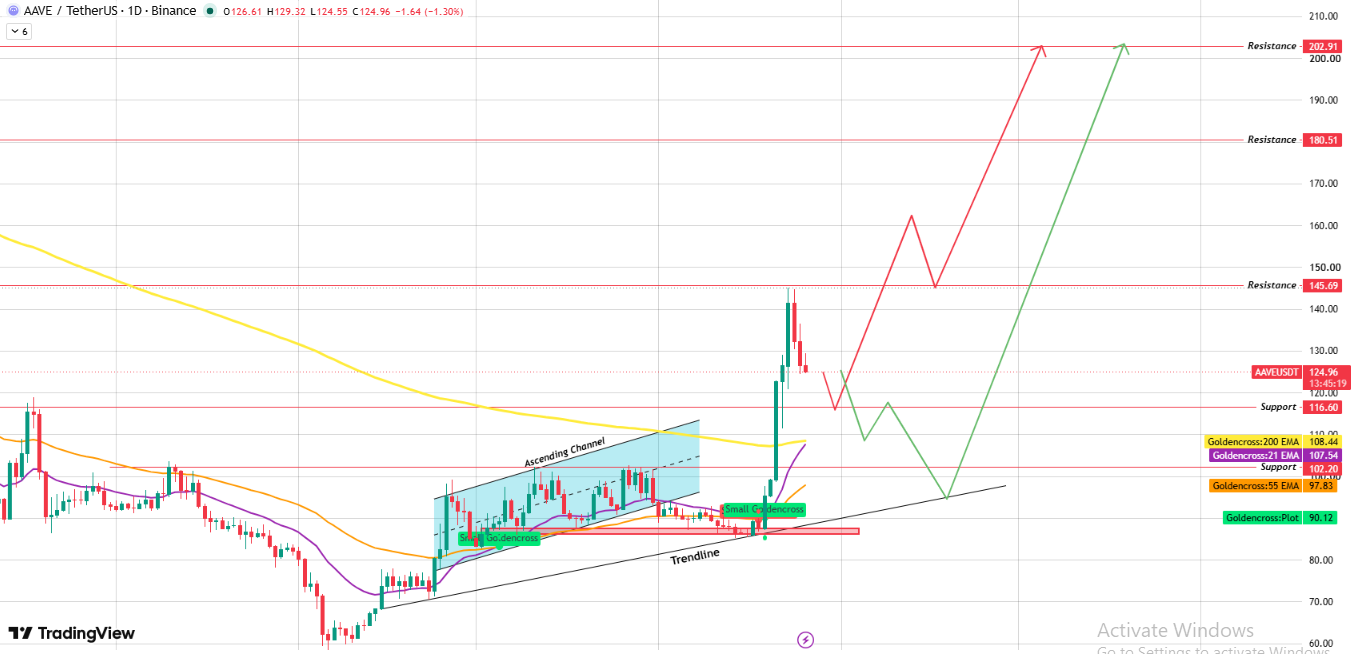
Source: Chart Taken From TradingView.
Price is now retesting that same support zone around $116.60, the level that triggered the sweep in the first place.
If this retest holds and buyers step back in with volume, the path opens toward $145.69, then $180.51, and eventually $202.91, marking the upside target zone for this Aave price prediction.
If instead the $116.60 support fails to hold, the more likely path is a drop to retest the rising trendline near $102.20, which lines up closely with the cluster of moving averages sitting just below the current price.
A volume-backed bounce from that trendline would still keep the broader bullish structure intact, while a break below it opens further downside risk.
Technical Analysis: Key Support and Resistance
Level Type | Price |
Resistance 3 | $202.91 |
Resistance 2 | $180.51 |
Resistance 1 | $145.69 |
Support 1 | $116.60 |
Support 2 | $102.20 |
Daily EMA Levels
EMA | Price |
200 EMA | $108.44 |
21 EMA | $107.54 |
55 EMA | $97.83 |
Aave Price Prediction: Bull, Base, and Bear Case
Scenario | Level | Setup | Invalidation |
Bull | $145.69 - $202.91 | AAVE holds the $116.60 support retest, bounces with volume, and pushes through $145.69 and $180.51 toward $202.91. | Daily close back below $116.60 |
Base | $116.60 - $145.69 | AAVE chops between the $116.60 support zone and $145.69 resistance, unable to clear either side with conviction while volume stays light. | Extended range trade without a confirmed break of either boundary |
Bear | $102.20 - $116.60 | The $116.60 support fails, the price drops to retest the rising trendline near $102.20, and a failure to hold there opens deeper downside. | Reclaim and hold above $116.60. |
On-Chain and Fundamental Drivers
AAVE's market cap of $1.928B sits close to its fully diluted valuation of $1.999B, with a circulating supply of 15.424M already near the 16M max supply, leaving limited room for future dilution.
Total value locked in the Aave protocol stands at $17.894B, a figure that dwarfs AAVE's own market cap and underscores how much capital the protocol itself commands regardless of short-term token price swings.
Daily trading volume of $251.965M relative to market cap points to solid liquidity for a token of this size.
Catalysts That Could Move the Price
Growth or contraction in Aave's total value locked remains the clearest fundamental signal to watch, since TVL trends often lead token price action in DeFi.
Broader risk appetite across DeFi tokens, tied closely to Ethereum price action, will likely set the outer limit for how far AAVE can extend any move.
Continued protocol development, including new market listings or upgrades, is worth tracking as a steady background catalyst for this Aave price prediction.
What Analysts Are Forecasting
Price estimates for this Aave price prediction vary across trackers, with no strong consensus on a single near-term number.
The more reliable approach is to treat the technical levels above as the actual forecast: the $116.60 support retest is the level bulls need to hold, and losing both $116.60 and the $102.20 trendline zone is the signal bears need for deeper downside.
Risks That Could Invalidate This Forecast
This entire technical picture rests on how $AAVE behaves at the $116.60 support zone and the rising trendline just below it.
A failure to hold either level, especially on rising volume from sellers rather than the recent long liquidations, would undercut the bullish case laid out here.
Beyond the chart, heavy whale concentration means large wallet movements could add volatility in either direction independent of the broader technical setup.
Disclaimer: This article is for informational purposes only and does not constitute financial advice. Cryptocurrency markets are highly volatile, and prices can move sharply in either direction without warning. Always do independent research and consult a licensed financial advisor before making investment decisions.

















