XRP Price Prediction June 2026: Can XRP Break $1.30 Zone?


The XRP price prediction June 2026 outlook has changed quickly after one of the token's sharpest recoveries of the year. XRP climbed roughly 13% in a single day, bouncing from the $1.03 support zone and reclaiming $1.28 for the first time in two weeks. As of June 16, 2026, XRP trades near $1.22 on Binance.
The key question now is whether it can turn the $1.30 area into support. A successful breakout could open the door toward $1.37, $1.65, $1.88, and eventually $2.00, while rejection could send the price back toward $1.10 or the $1.02–$1.03 support zone.
XRP Price Prediction June 2026: Why Did XRP Rally?
The immediate catalyst was broader macro sentiment rather than a specific announcement. Reports confirming a resolution to the US-Iran conflict pushed risk assets higher across global markets.
It had already fallen 6.70% during the previous week and was trading near some of its lowest sentiment readings of 2026. The combination of deeply negative sentiment and improving macro conditions created the setup for a sharp relief rally.
However, the recovery needs confirmation. The analysis today still shows XRP inside a descending channel that began in mid-2025. Until that structure is broken convincingly with stronger trading volume, the broader trend cannot yet be considered fully bullish.
$XRP Technical Analysis: What Are the Key Levels?
The daily chart shows bouncing directly from the 0.786 Fibonacci retracement near $1.0237. This reaction suggests buyers defended an important technical zone after the recent decline.
The RSI currently stands at 49.29, indicating neutral momentum. The rsi is therefore not signaling either an overbought rally or an extreme oversold condition.
The main resistance is concentrated around $1.28–$1.30. The 50-day EMA sits near $1.2831, making this area particularly important. A confirmed daily close above $1.30 could signal that momentum is shifting.
The next moving averages to watch are:
- 100-day EMA: $1.3765
- 200-day EMA: $1.5833
- 0.618 Fibonacci level: $1.5886
- Higher targets: $1.65, $1.88, and $2.00
These fibonacci levels create a series of resistance zones rather than one single barrier.
For traders researching XRP support and resistance levels, the immediate support zone remains $1.02–$1.03, followed by $1.10. On the upside, $1.30 is the first major breakout level, followed by $1.37 and $1.58–$1.65.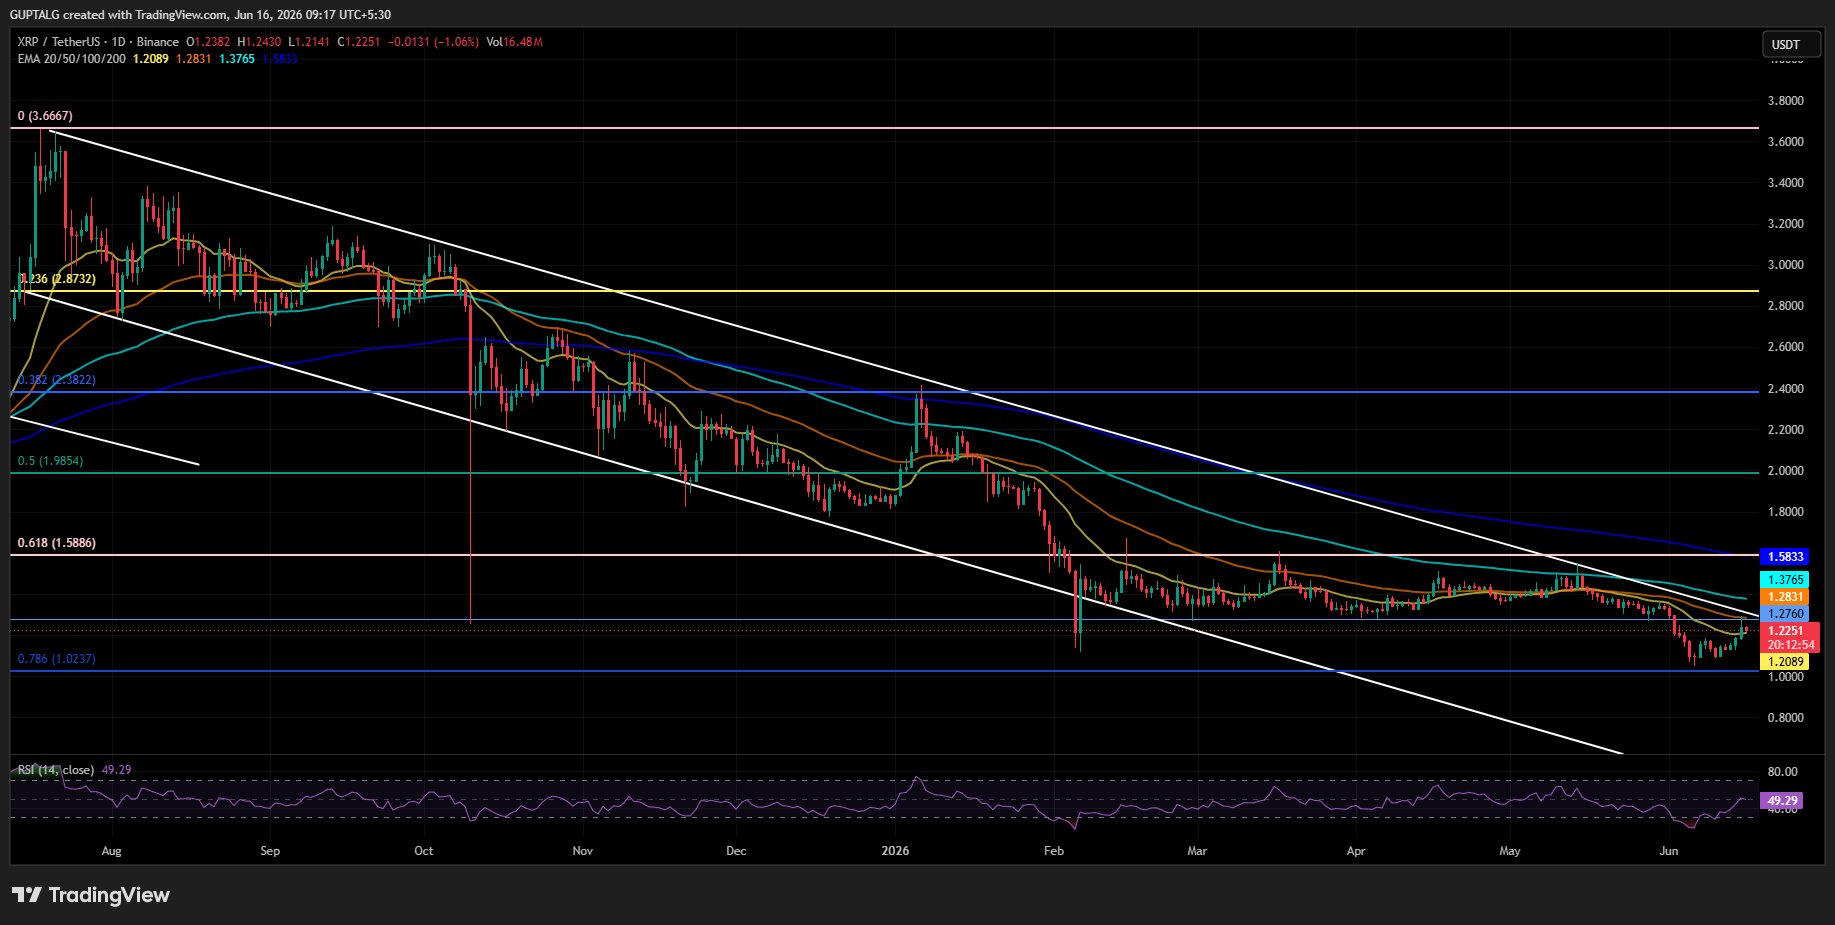
What Does the $XRP Forecast Model Show?
The forecast model used in this analysis combines four major factors: RSI momentum, EMA positioning, Fibonacci retracement levels, and trading volume. MVRV and whale accumulation data are used as secondary confirmation rather than direct price predictors.
Currently, the model remains mixed.
The RSI is neutral, while it is still below several major moving averages. The Fibonacci structure offers clear upside levels if $1.30 breaks, but the descending channel remains a bearish factor.
MVRV and whale data provide a more constructive long-term signal. Wallets holding at least 1 million $XRP now control approximately 74.1% of circulating supply, with large holders reportedly accumulating 1.53 billion tokens over six months.
That suggests larger holders have been buying while retail sentiment was weak. However, concentration among large wallets can also increase volatility, so accumulation should not be treated as a guaranteed bullish signal.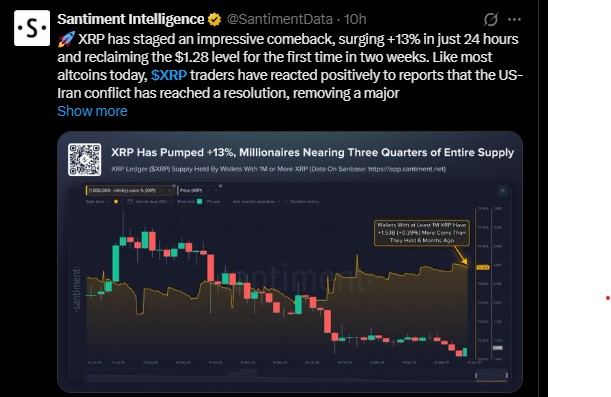
$XRP ETF Flows and Institutional Demand
ETF flows remain an important factor in the broader XRP price prediction 2026 narrative. Recent ETF demand has been mixed, meaning institutional flows have not yet provided a consistently strong catalyst for a sustained breakout.
The latest weekly ETF-flow figure should be viewed alongside price rather than in isolation. Positive flows combined with rising spot volume would strengthen the bullish case, while continued outflows alongside weak volume could undermine the recovery.
For now, the market needs to see whether institutional demand can support above $1.30 after the initial macro-driven bounce.
$XRP Price Target: Bull, Base and Bear Scenarios
The following scenarios combine the technical structure with broader market assumptions. These probabilities are analytical estimates, not guaranteed outcomes.
| Scenario | Target | Probability | Key Assumption | Invalidation |
|---|---|---|---|---|
| Bull case | $1.65–$2.00 | 30% | It breaks $1.30 and clears major EMAs with volume | Daily close below $1.02 |
| Base case | $1.10–$1.65 | 50% | It consolidates and gradually tests resistance | Sustained loss of $1.02 |
| Bear case | $0.80–$1.03 | 20% | Breakout fails and the descending channel remains dominant | Strong close above $1.30 |
The base case currently carries the highest probability because it remains between major support and resistance zones.
How Does $XRP Compare With Other Price Targets?
Analyst forecasts vary considerably, highlighting the uncertainty around long-term projections.
Standard Chartered has previously been associated with a more conservative multi-year outlook around the $2.80 region. EGRAG Crypto has discussed substantially higher cycle targets, with some projections in the $7–$10 range. Longer-term chart-based projections in the source analysis also point toward levels such as $2.99, $5.53, and $12.04.
These forecasts are not directly comparable because they use different timeframes and assumptions. The key takeaway is that the xrp price target depends heavily on whether it can transition from its current corrective structure into a sustained bull cycle.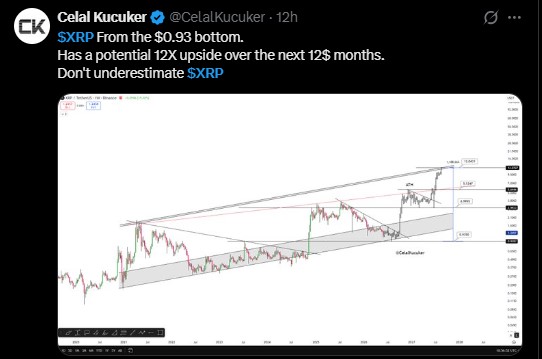
$XRP Price Prediction Today: What Happens Next?
The xrp price prediction today depends primarily on the $1.28–$1.30 resistance zone.
If it breaks above $1.30 and holds it as support, the next targets are $1.37, $1.58–$1.65, $1.88, and potentially $2.00.
If bulls fail to defend the breakout, it could return to $1.10. A deeper breakdown below $1.02–$1.03 would weaken the recovery thesis and potentially expose the $0.93 long-term base.
This also answers questions such as will it go up tomorrow and xrp price prediction this week: the near-term trend remains dependent on confirmation above $1.30 rather than the one-day 13% rally itself.
XRP Price Prediction 2026: Long-Term Outlook
The broader xrp forecast remains cautiously constructive but highly dependent on market conditions.
A sustained crypto bull market, stronger institutional adoption, improving ETF demand, and continued whale accumulation could push XRP toward higher cycle targets. Ripple's institutional payment network and XRPL tokenization activity may also support the long-term ecosystem narrative.
However, regulatory uncertainty, Bitcoin weakness, falling trading volume, and failure to reclaim major moving averages remain important risks.
For readers asking is XRP a good buy right now, the answer depends on risk tolerance and timeframe. The technical setup is not yet a confirmed breakout, while the long-term accumulation signals are more constructive.
The key question is whether it can turn $1.30 from resistance into support. Until that happens, the market remains xrp bullish or bearish depending on the timeframe: cautiously bullish on long-term accumulation, but still technically neutral-to-bearish until the descending structure breaks.
June 2026 Prediction Accuracy Check
The earlier thesis identified $1.03 as a critical support zone and $1.30 as the key resistance level. It subsequently bounced from around $1.03 and moved back toward $1.28, validating the importance of the support zone.
However, the $1.30 breakout has not yet been confirmed. Therefore, the original forecast remains partially validated: support held, but the bullish breakout condition still needs confirmation.
Final $XRP Price Prediction June 2026
The XRP price prediction June 2026 outlook is now centered on a simple technical battle. Holding $1.02–$1.03 keeps the recovery structure alive, while reclaiming $1.30 could open the path toward $1.37, $1.65, $1.88, and $2.
The longer-term forecast remains more ambitious, with analyst and cycle-based projections reaching considerably higher levels. But those targets require sustained momentum, stronger volume, favorable ETF flows, and a broader crypto bull market.
For now, $1.30 remains the level that could decide its next major move.
Disclaimer: This article is for informational purposes only and does not constitute financial, investment, or trading advice. Cryptocurrency markets are highly volatile and carry significant risk. Price projections and analyst targets are speculative and are not guarantees of future performance. Always conduct your own research and consult a qualified financial adviser before making investment decisions.











.jpg)






