Zcash Price Prediction: $ZEC Hits 8-Year New High, Rally Begins?


$ZEC is on fire, trading near $1,015.98 after smashing an 8-year high just days ago.
CoinGecko's own tweet confirmed the milestone, and the buzz has only grown since Zcash's Grayscale ETF went live on NYSE Arca.
This Zcash price prediction looks at the Fibonacci levels, mining activity, and liquidation data shaping where ZEC goes from here.
Market data was checked on September 5, 2026, at 12:32 PM IST.
Market Overview and $ZEC Outlook
| Metric | Value |
| Price | $1,015.98 |
| 24h Change | +6.84% |
| Market Cap | $17.13B |
| Volume (24h) | $1.54B (+27.55%) |
| Vol/Mkt Cap (24h) | 9.05% |
| FDV | $21.34B |
| Total Supply | 16.85M ZEC |
| Max Supply | 21M ZEC |
| Circulating Supply | 16.85M ZEC |
Source: Data from CoinMarketCap as of September 5, 2026, at 12:32 PM IST. Figures may vary slightly across other tracking websites.
$ZEC Mining Surge: The Block's Tweet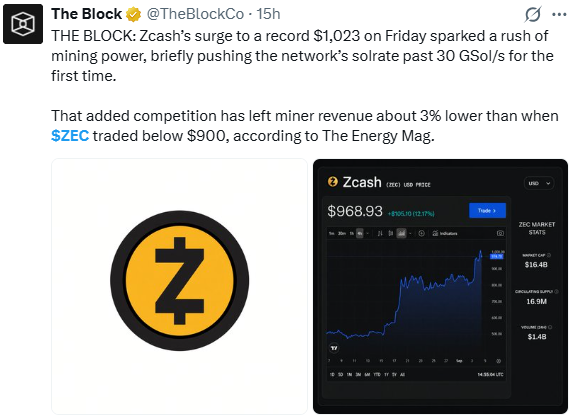
Source: Data From X
The Block reported that Zcash's surge to a record $1,023 on Friday triggered a rush of mining power, briefly pushing network solrate past 30 GSol/s for the first time.
The added competition left miner revenue about 3% lower than when ZEC traded below $900, citing The Energy Mag.
This suggests the rally is drawing in new miners faster than rewards can keep pace.
Zcash ETF Milestone: $ZEC Crypto News Today
CoinGecko's official account confirmed ZEC hit a new 8-year high of $979, just over a week after its Grayscale ETF went live on NYSE Arca.
The ETF listing marks a significant step for institutional access to ZEC. This timing lines up closely with the broader price surge seen across the past two weeks.
Zcash Liquidation and Volume Data
Futures liquidations (Coinglass): over the past 1h, $25.54K was liquidated ($5.20K longs, $20.34K shorts).
Over 4h, liquidations hit $371.91K ($205.06K longs, $166.84K shorts).
The 12h total reached $2.45M ($1.07M longs, $1.39M shorts), and 24h liquidations totaled $31.32M ($4.98M longs, $26.34M shorts).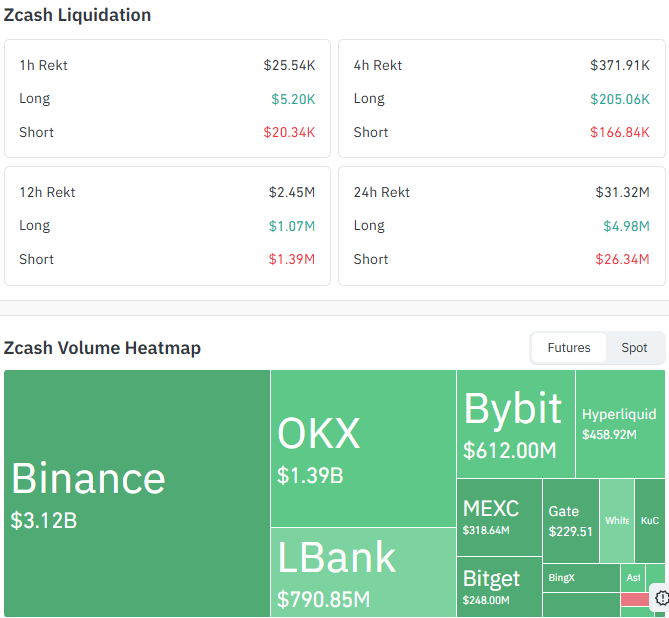
Source: Data From CoinGlass
Futures volume by exchange (Coinglass): Binance leads with $3.12B, followed by OKX at $1.39B and LBank at $790.85M.
Bybit posted $612.00M, Hyperliquid $458.92M, and MEXC $318.64M, with smaller volumes from Gate, Bitget, WhiteBIT, KuCoin, and BingX. This futures data is separate from the CoinMarketCap spot volume figure above.
Zcash Chart Analysis: ZEC Price Today and Outlook
Chart setup: ZEC/USDT on CoinEx, 4-hour timeframe, snapshot taken September 5, 2026, at 04:02 UTC-3.
$ZEC has been climbing steadily since around August 21, when it was trading near $780–800.
The uptrend built gradually through late August, then accelerated sharply starting September 3, with a big green candle pushing the price from around $880 up toward $1,047 in a short burst.
This kind of vertical move usually triggers a pullback.
Price hit a high of $1,047.46 and has since pulled back to the current $1,015.98.
The Fibonacci levels on this chart are drawn from that recent rally leg, and they're being used to map out where a pullback might find support or where a continuation might target next:
Moving averages: The EMA cluster (20/50) sits at $941.05 (20 ema) and $876.09 (50 ema), both trending upward.
Price is currently trading above both, which keeps the broader uptrend structure intact even with this pullback.
The dotted projection line: This is a common "buy-the-dip."
Bottom line on the chart: Zcash is in an active uptrend that just hit resistance at $1,047 and is cooling off.
The $941 & $949 zone is the level to watch; holding it keeps the uptrend intact, while a break below could open the door to $919 or $883.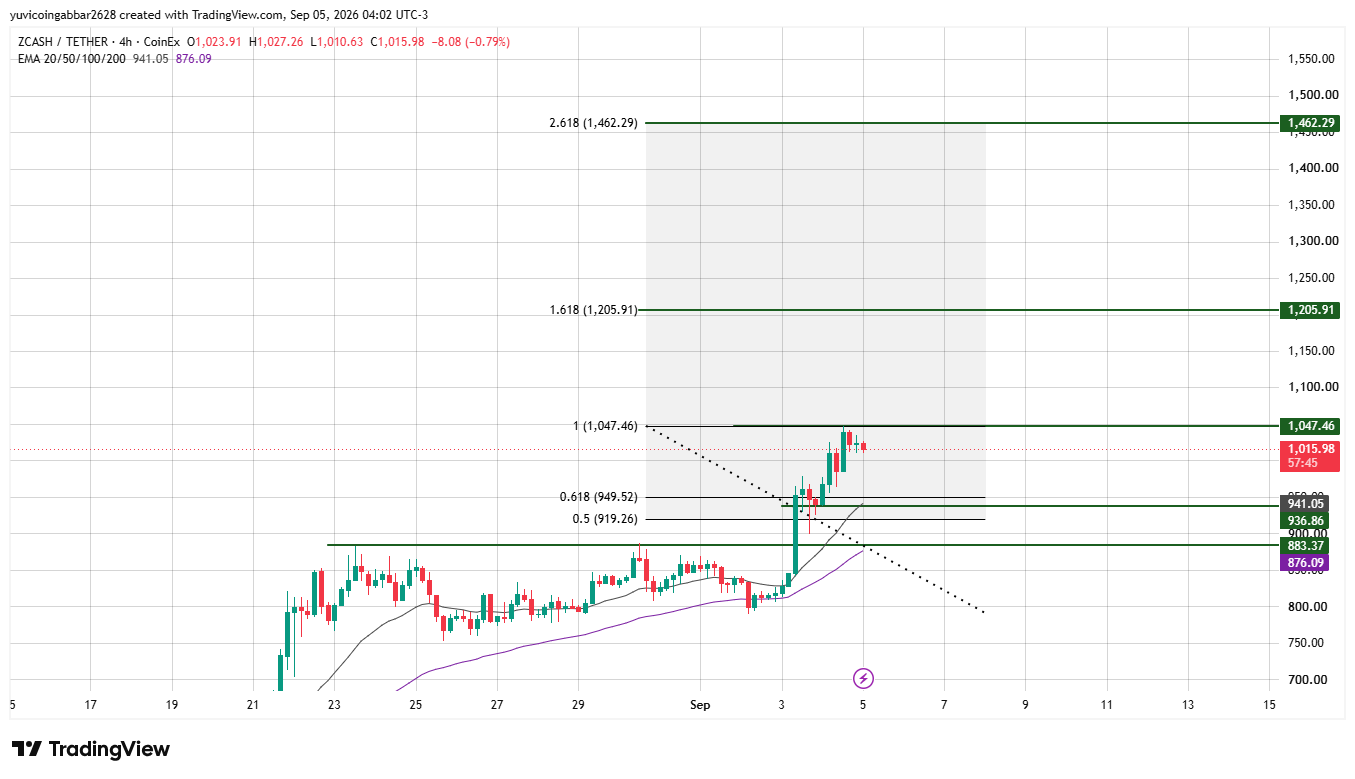
Zcash Price Prediction Long-Term: Key Levels to Watch
| Level | Price | What it marks |
| 2.618 extension | $1,462.29 | Far upside level if the rally resumes strongly |
| 1.618 extension | $1,205.91 | Next upside level above the recent high |
| 1.0 (swing high) | $1,047.46 | The recent peak, now acting as resistance |
| 0.618 retracement | $949.52 | Key support zone, lines up closely with the EMA |
| Secondary marker | $936.86 | Just below the 0.618 zone |
| 0.5 retracement | $919.26 | Mid-level support if the pullback deepens |
| Horizontal support | $883.37 | A zone that held multiple times during the earlier climb |
Zcash Price Forecast: Bull Case vs Bear Case
Bull case: ZEC holding above the 0.618 level at $949.52 keeps the bullish structure intact.
A clean break above $1,047.46 would open the path toward the 1.618 extension at $1,205.91, with the 2.618 extension at $1,462.29 as the next major target if momentum sustains.
Bear case: A drop below $949.52 would signal weakening momentum, risking a slide toward the 0.5 level at $919.26.
Losing $919.26 would invalidate the current bullish structure and suggest a deeper pullback is underway.
Zcash Price Scenarios: Triggers and Invalidation
| Scenario | Trigger | Likely Outcome | Invalidation Point |
| Trendline reclaim (bullish) | Break and hold above $1,047.46 | Move toward $1,205.91 | Close back below $1,047.46 |
| Channel hold | Price stays between $949.52 and $1,047.46 | Sideways consolidation | Break of either boundary |
| Channel breakdown (bearish) | Close below $949.52 | Slide toward $919.26 | Reclaim of $949.52 |
$ZEC Future Price: Can Zcash Reach $1,462.29?
The 2.618 extension at $1,462.29 marks the highest level on this chart.
ZEC would need to clear $1,047.46 and then $1,205.91 in sequence, with sustained volume and continued institutional interest from the ETF listing.
Given the pace of the recent rally, this level isn't out of reach, but it would likely require another strong leg up rather than a single move.
Could Zcash Be the Next Bitcoin?
Bitcoin trades at $79,684.74 today, down 1.27%, and still leads every bitcoin price prediction discussion.
Zcash isn't trying to replace that, but its rally to $1,047 has traders asking anyway.
The market cap gap remains massive despite ZEC's recent surge. Zcash's edge is optional privacy via zero-knowledge proofs, something Bitcoin doesn't offer.
Any zcash price prediction sees it as the privacy-coin leader, not a Bitcoin replacement.
Zcash Price Prediction 2026: $ZEC Expert View
According to CoinGabbar analysts , This Zcash price prediction shows a rally still supported by strong fundamentals, from the Grayscale ETF listing to rising network activity.
The mining squeeze flagged by The Block is worth watching, since falling miner profitability at these levels could affect network security incentives over time.
Data Sources
Price, market cap, and volume data: CoinGecko. Liquidations and futures volume: Coinglass. EMA and Fibonacci levels: TradingView, 4H ZEC/USDT chart on CoinEx, checked September 5, 2026, 04:02 UTC-3.
Disclaimer
This article is for informational purposes only and should not be considered financial advice. Cryptocurrency markets are highly volatile. Always do your own research before making investment decisions.

















