Zora Price Prediction: Why Is ZORA Rallying So Hard Right Now Today


Zora Price Prediction: Custom Pairs Just Changed Everything for $ZORA
Something moved fast on Zora this week, and traders noticed before most headlines caught up. A quiet product launch turned into one of the sharpest single-day moves the token has seen in months. What actually triggered it, and does it hold?
Zora Just Had Its Loudest Week in Months. Here Is Why That Matters
Our ZORA price prediction starts with one plain fact: this rally did not come out of nowhere. Something shipped, and it landed at exactly the right moment.
Zora, the onchain content and creator-coin protocol, spent the back half of August rolling out custom trading pairs across Solana, Base, and Robinhood. Traders read that as a real product win.
But product news alone rarely moves a chart this fast. Turns out, thin liquidity plus a genuine catalyst is dangerous for short sellers. Squeezed positions did the rest.
Will that momentum survive the next few sessions? Keep that in mind as we walk through the data.
$ZORA Data Snapshot (as of 18:40 UTC, August 31, 2026)
This section stands on its own, separate from the analysis below, so the numbers are easy to reference.
Price: $0.0110, up 76.65% on the day
24h range: $0.006219 to $0.01198
Market cap: $49.19M (+76.65%)
Fully diluted valuation: $110.06M
24h volume: $141.74M, up 1,073.44%
Volume to market cap ratio: 276.56%
Circulating supply: 4.46B of a 10B max supply
Holders: 1.12M, per live ZORA market data
All-time high: $0.1471 (Aug 11, 2025), still 92.25% below that peak
All-time low: $0.004669, set just 12 days ago
That last line matters. ZORA touched a fresh low less than two weeks before this rally.
What Is Driving $ZORA Price Up Today
Zora did not just announce custom pairs; it shipped them fast and kept shipping. The official account confirmed multichain issuance across Solana, Robinhood, and Base, with crosschain trading live from day one.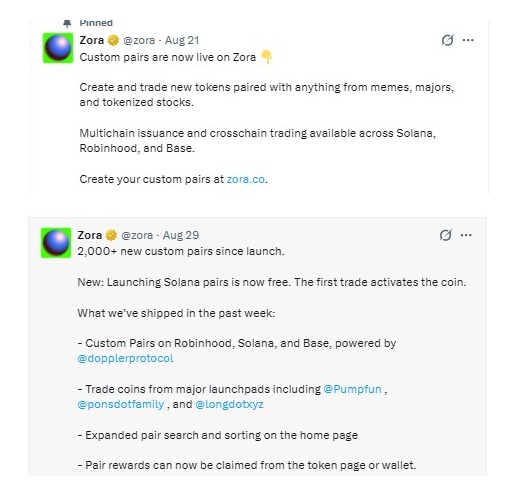
By August 29, Zora reported more than 2,000 new custom pairs since launch, plus free Solana pair listings and expanded search on the home page.
And that is a real usage signal, not just a headline. New pairs mean new activity, and fresh activity in a small-float token moves price fast.
We also checked how that activity split across venues. Binance carried the heaviest futures volume at $135.54M, with OKX close behind at $103.50M and LBank at $48.02M. That is a broad spread, not a single-exchange pump.
ZORA Daily Chart Analysis and Technical Analysis
On the daily chart, ZORA spent months grinding lower inside a descending channel before this week's candle broke straight through the upper trendline. That is the single most important structural change on the chart right now.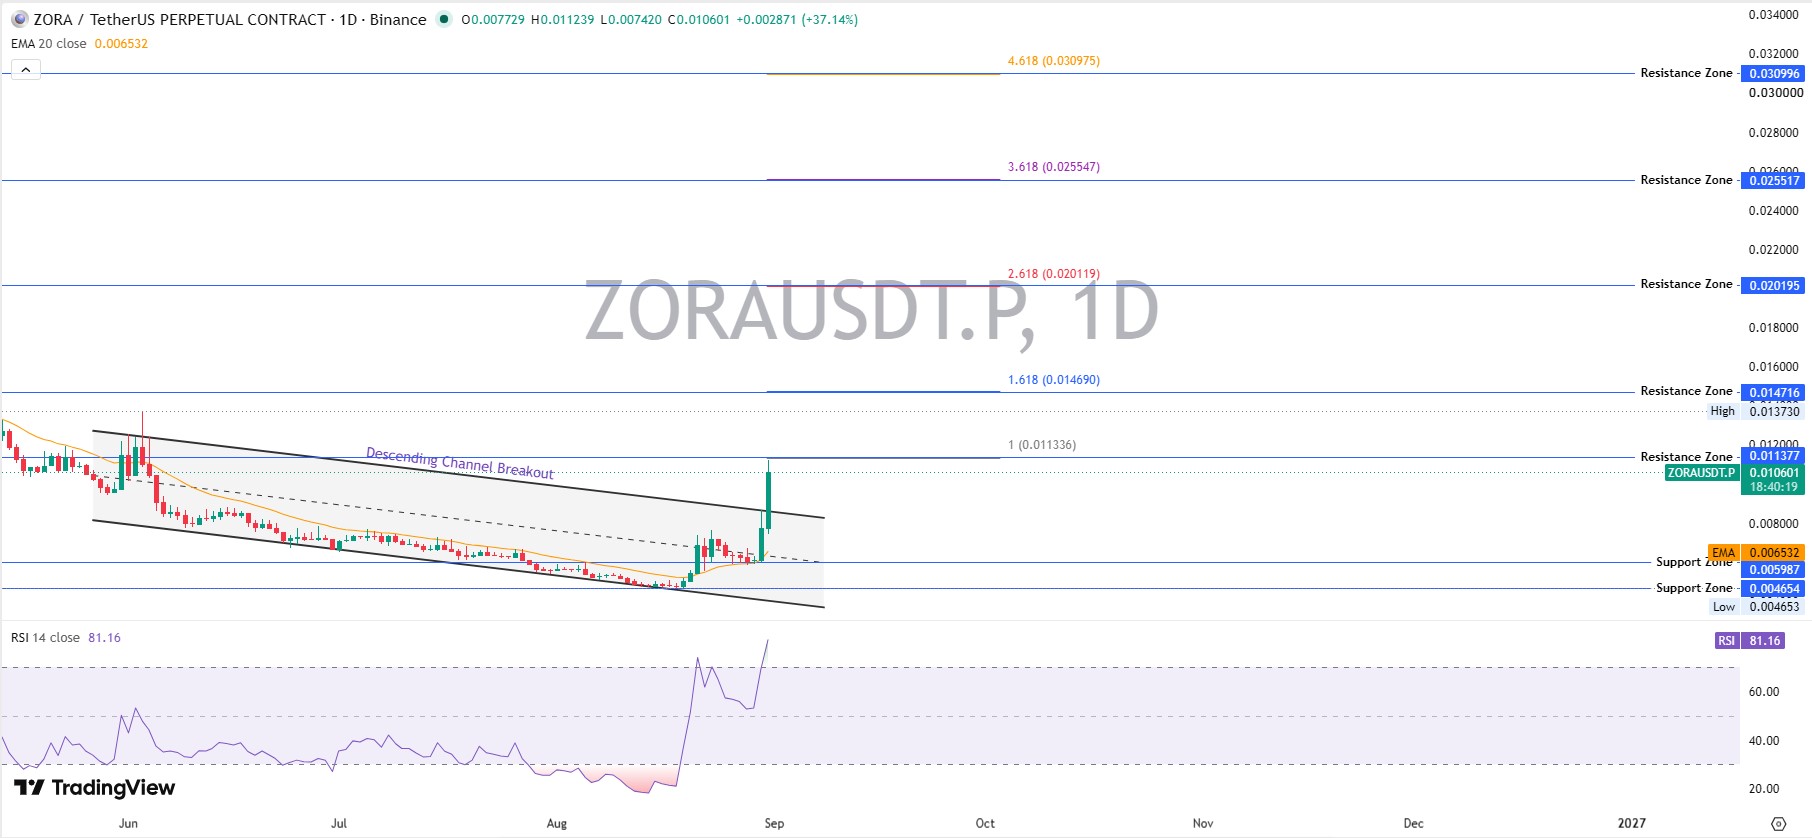
Technical analysis on the 1D timeframe shows the token trading well above its 20-period EMA near $0.006532, a gap that usually signals strong short-term bullish momentum. The RSI sits at 81.16, deep in overbought territory. That is not automatically bearish, but it raises the odds of a cooldown candle before the next leg.
Trading volume expanded sharply into the breakout candle, which lines up with the liquidation data below. The structure looks constructive. But overbought readings this extreme rarely extend in a straight line.
$ZORA Support and Resistance Levels
Level Type | Price Zone | Notes |
Resistance | $0.011377 | Immediate breakout retest zone |
Resistance | $0.014716 | 1.618 extension |
Resistance | $0.020195 | 2.618 extension |
Resistance | $0.025517 | 3.618 extension |
Resistance | $0.030996 | 4.618 extension |
Support | $0.005987 | First reaction zone below the breakout |
Support | $0.004654 | Recent swing low |
ZORA Whale Activity and Holder Concentration
Onchain data adds a layer the chart cannot show. Per ZORA token contract records, the top 100 wallets hold 93.62% of supply, and the top five alone control 45.98%.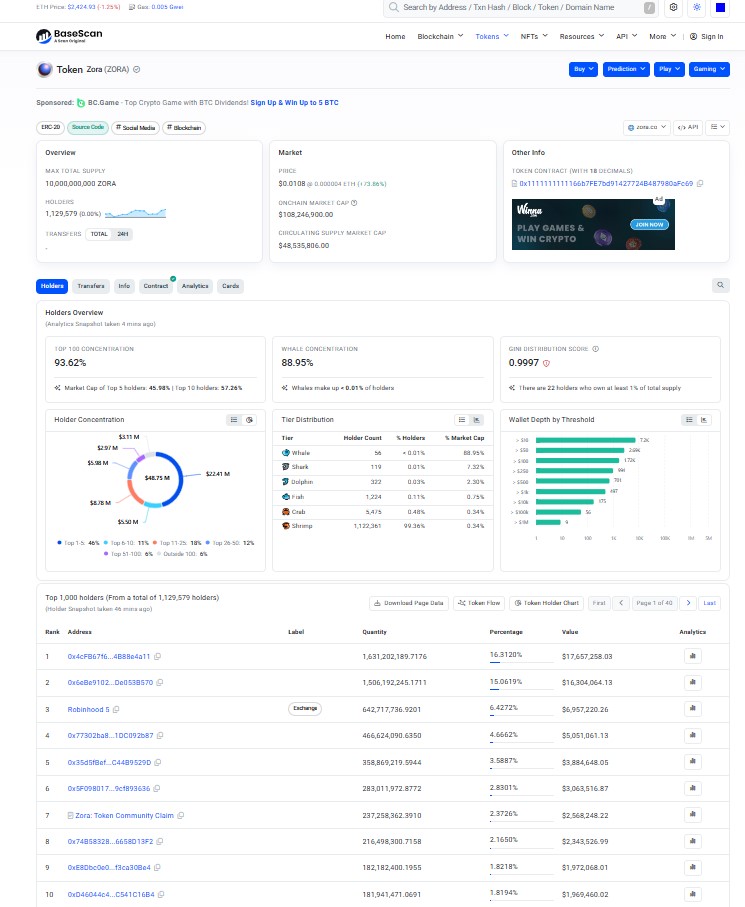
That concentration is extreme. A Gini score of 0.9997 confirms it. Fifty-six wallets, classified as whales, hold 88.95% of the entire supply between them.
Robinhood's exchange wallet sits inside the top 10 holders, alongside a dedicated Zora community claim address. Two very different kinds of large holders, sitting side by side.
Basically, a handful of wallets can move this market more than any single piece of market sentiment. Worth watching before sizing any position.
$ZORA Liquidation Data and Market Sentiment
This part reads like breaking news, because it basically is. In the last 24 hours, $1.09M in positions got liquidated. Shorts took the bigger hit, losing $691.86K against $394.52K on the long side.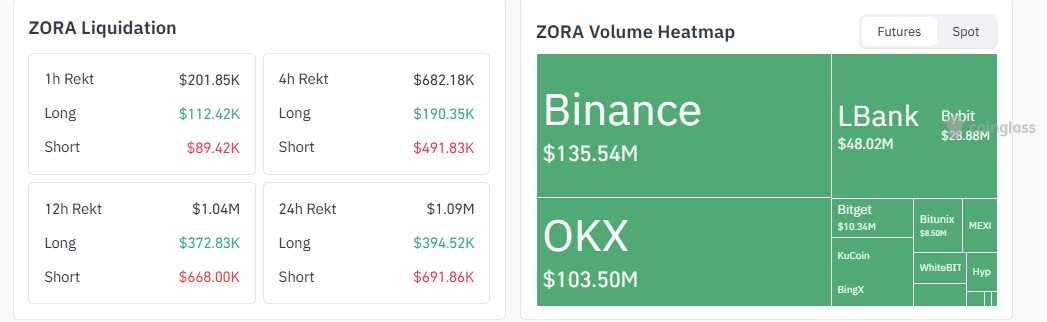
Zoom into the last four hours and the pattern sharpens. $682.18K wiped out, with shorts again absorbing the bulk at $491.83K. Full ZORA liquidation data is public and updates live.
ZORA Price Prediction: Bear, Base, and Bull Scenarios
Timeframe | Bear Case | Base Case | Bull Case | Probability | Invalidation |
7 Days | $0.0075 | $0.0095 to $0.0110 | $0.0143 to $0.0147 | Bear 30% / Base 45% / Bull 25% | Trading sustains below $0.0075 |
30 Days | $0.0060 | $0.0110 to $0.0150 | $0.0195 to $0.0202 | Bear 25% / Base 40% / Bull 35% | Trading sustains below $0.0060 |
Early 2027 | $0.0047 | $0.0150 to $0.0250 | $0.0300 to $0.0310 | Bear 20% / Base 45% / Bull 35% | Loss of the $0.0047 swing-low zone |
These bands are scenario ranges, not guarantees. If new venues pick up $ZORA pairs, keep an eye on exchange listing news since fresh listings tend to shift volume fast.
Zora as an Altcoin: Where It Fits in the Creator Economy Trade
Zora is not a memecoin chasing a trend. It is an altcoin built around tokenizing content and creators, now expanded with custom trading pairs spanning Solana, Base, and Robinhood.
That multichain push is the whole story here. Instead of competing for liquidity on one chain, Zora is pulling volume from several at once, pairing new tokens against memes, majors, and even tokenized stocks.
For anyone comparing this against broader altcoin rotation, it helps to track crypto price predictions across similar mid-cap tokens, since capital often rotates as a group rather than one coin at a time.
Robinhood's involvement adds another layer worth watching. A regulated brokerage offering custom crypto pairs is not something that happens every day, and it could pull in a different type of buyer than the usual crypto-native trader.
Some of that new pair activity also touches fresh token launches directly. Worth a look at upcoming crypto airdrops tied to projects issuing custom pairs on Zora.
What Could Invalidate This ZORA Price Prediction
An RSI above 80 does not guarantee a pullback. But it does mean risk sits closer to the surface than it did a week ago.
If $ZORA loses the $0.005987 zone on strong volume, the breakout thesis weakens fast. And if whale wallets start moving size toward exchanges, that alone could flip market sentiment before any chart signal confirms it.
Broader risk also comes from outside the token itself. Regulatory headlines, like ongoing regulatory clarity news in Washington, tend to move small-cap altcoins along with the majors.
None of that is specific to $ZORA. But it sets the backdrop every altcoin trades against, and it matters more when a token has moved this fast in such a short window.
Geopolitics counts too. Watch geopolitical crypto risk, since these headlines can pull liquidity out of tokens like $ZORA regardless of their own fundamentals.
Final Take on the $ZORA Price Prediction
Is this rally real? Mostly, yes. Product usage backed it, exchange volume backed it, and the short squeeze added the final push.
But a 76% single-day move with RSI at 81 is not a straight road higher. Expect a chop, and expect a retest of the breakout zone before the upper fib levels come into play.
Noted. The base case leans constructive, not euphoric, and that is probably the healthier outcome anyway.
For broader context beyond this one token, crypto news today is a good place to check what else is moving the wider market this week.
Zora's rally happened inside a fast-moving news cycle, not a vacuum. That is worth remembering the next time a single-day move looks too clean to be real.
New pairs also tend to attract short-lived attention. Some background on token airdrop tokenomics is worth a read before treating any new listing like a sure thing.
Disclaimer
This article is for informational purposes only and does not constitute financial, investment, or trading advice. Cryptocurrency markets, including tokens like $ZORA, are highly volatile, and prices can change rapidly. Always conduct independent research and consult a qualified financial advisor before making any investment decisions.
Also read:
















