Pump.fun Price Prediction: 29.8% Supply Burned, Why Is PUMP Falling?

Pump.fun says its buybacks have now removed almost 30% of the circulating PUMP supply, yet the token is down 2.1% today.
Does the Pump.fun price prediction October 2026 reward the burn headline, or does the market need more proof?
Pump.fun is a Solana-based launchpad that lets users create and trade meme coins without writing code.
The Pump.fun coin, PUMP, launched in July 2025, and the project has since run a buyback program for the token.
According to CoinGecko, Pump.fun price today is $0.006284, down 2.1% over the last 24 hours.
The market capitalization is $2.917B, which places PUMP at rank 41. The token traded between $0.006228 and $0.006684 during that period.
Live Pump.fun (PUMP) Market Data
Metric | Value |
Price | $0.006284 |
24h Change | -2.1% |
24h Range | $0.006228 to $0.006684 |
Market Cap | $2.917B |
Source: market data taken from CoinGecko, as of Oct 6, 2026. Figures may vary slightly across other tracking websites.
Pump.fun (PUMP) News Today
Pump.fun's ecosystem account on X reported that the platform bought back and burned $8,200,000 worth of PUMP over the past seven days.
It said total buybacks and burns have reached $474,740,000. According to the post, that removes 29.844% of the circulating supply.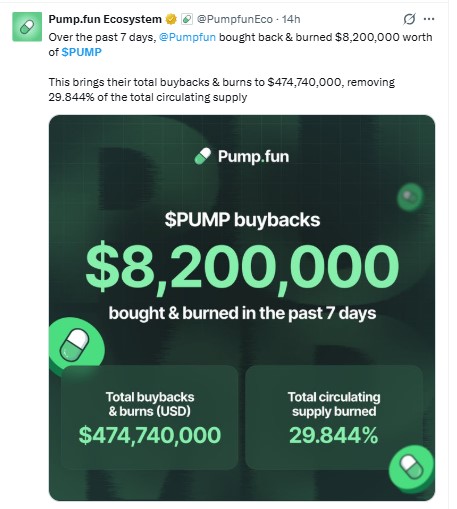
Source: Data Taken From @PumpfunEco X Account.
These figures are self-reported by the project and have not been independently checked here. Readers should confirm them through official dashboards and on-chain records.
Burns reduce supply, but price also depends on demand. PUMP is down 2.1% today despite the update, so the market has not yet treated the burn total as a catalyst in this Pump.fun news cycle.
Source: Pump.fun ecosystem account on X, as of October 6, 2026
Pump.fun Price Prediction: Hourly Technical Analysis
This Pump.fun technical analysis uses the Binance PUMP/USDT 1-hour chart captured on October 6, 2026.
The latest 1H candle was still open at 0.006300, up 0.56%, and had about 32 minutes left. Every level below refers to a completed 1H candle close. Hourly signals can reverse quickly, so the levels suit short-term traders.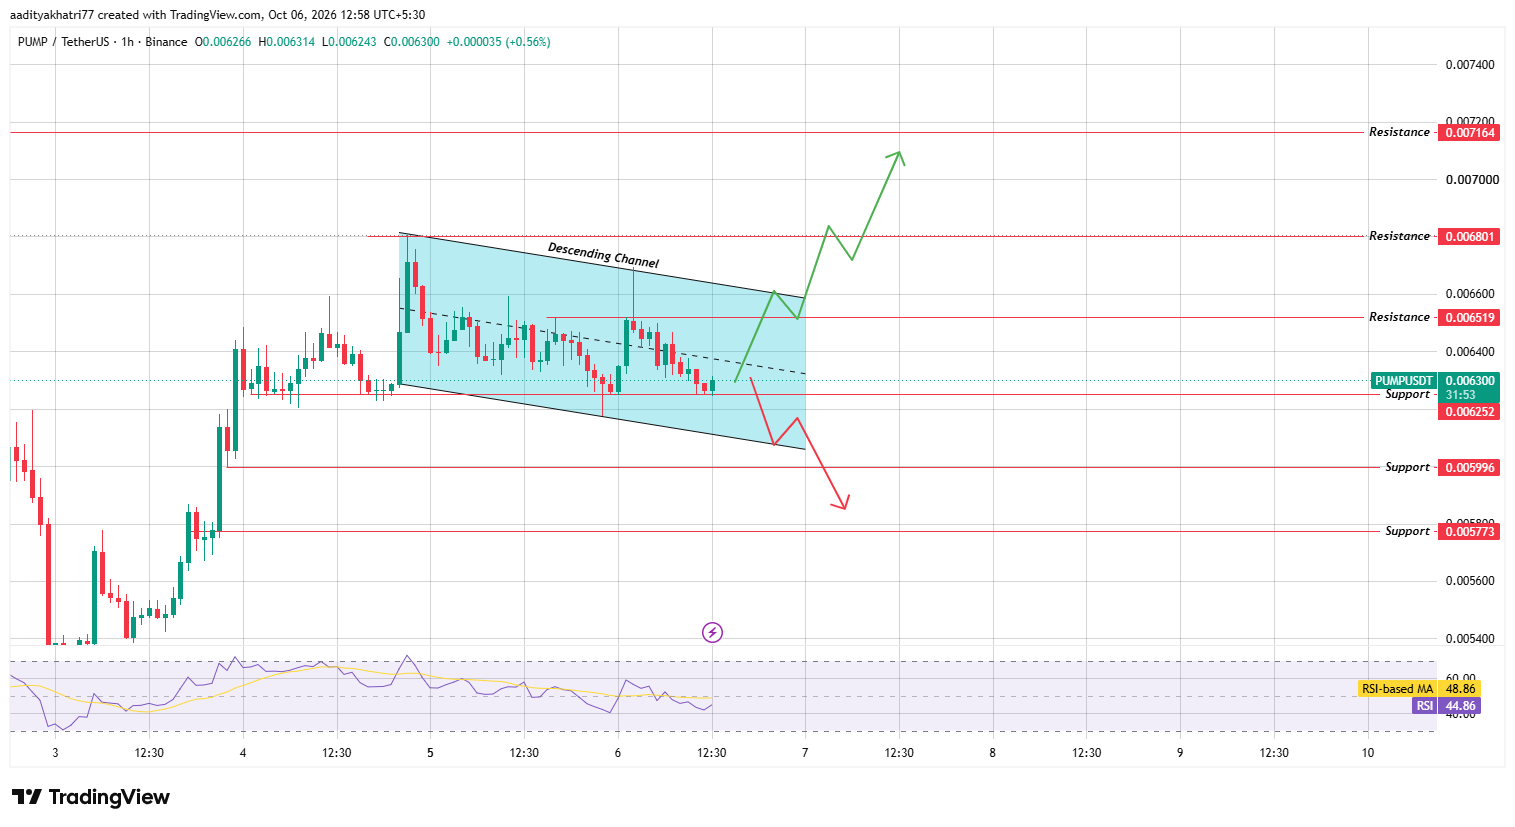
Source: TradingView, PUMP/USDT 1H, Binance, as of October 6, 2026
Price is moving inside a descending channel, where both boundaries slope down. The channel starts from the October 4 high near 0.00681.
An early October 6 spike toward 0.00668 was rejected near the upper boundary. The price now sits just above the 0.006252 support.
RSI reads 44.86, below its moving average at 48.86. It also sits under the 50 midline, so momentum leans soft.
Can Pump.fun Bounce and Break the Channel's Upper Boundary?
The bullish case starts with a bounce from the 0.006252 support, backed by volume above the 20-candle 1H average.
Price then needs a 1H close above the 0.006519 resistance, which is about 3.5% above the current price. That level sits inside the channel.
Above it, the next test is the channel's upper boundary, which sits only slightly higher.
A 1H close above that line with above-average volume confirms the breakout. A wick through it does not count.
From there, 0.006801 is about 8.0% higher. The final marked resistance is 0.007164, near 13.7% above the current price.
What Happens If Pump.fun Breaks Support?
The bearish case begins with a 1H candle close below 0.006252, with above-average volume.
That level is only about 0.8% under the current price, so the test could come quickly.
The next step is a close below the channel's lower boundary, which confirms the downside break.
From there, 0.005996 is about 4.8% lower. The final marked support is 0.005773, roughly 8.4% below the current price. A rejection at 0.006519 before the break would add weight to this outcome.
Price Levels to Watch
Support | Resistance |
0.006252 | 0.006519 |
0.005996 | 0.006801 |
0.005773 | 0.007164 |
Bull, Base, and Bear Scenarios
For the Pump.fun price prediction October 2026 window, three outcomes stand out.
Scenario | Setup | Level |
Bull | Bounce from support, then a 1H close above resistance and the upper boundary with above-average volume | 0.006519, then 0.006801 and 0.007164 |
Base | Price stays inside the channel. | Range between 0.006252 and 0.006519 |
Bear | 1H close below support, then below the lower boundary with above-average volume | 0.006252, then 0.005996 and 0.005773 |
Pump.fun vs Bitcoin
$PUMP fell 2.1% in dollar terms and 1.0% against Bitcoin. That implies Bitcoin itself slipped by roughly 1.1% over the same 24 hours.
As a mid-cap altcoin, PUMP often moves more than Bitcoin in both directions.
The Pump.fun price prediction therefore depends on a steady Bitcoin as well as the channel.
A further Bitcoin drop could push $PUMP through 0.006252 even if the burn story stays positive.
Methodology
The levels in this article come from the Binance PUMP/USDT 1-hour chart on TradingView, captured on October 6, 2026, at 12:58 UTC+5:30.
Support and resistance reflect horizontal levels where price reacted before. Both channel boundaries are drawn from the October 4 and October 5 swing points.
Market data comes from CoinGecko, and the news item comes from the project's own post on X. Percentage distances use the 0.006300 price from the chart.
Confirmation rules rely on 1H candle closes and volume against the 20-candle average. This Pump.fun price prediction is a scenario map, not a promise of a fixed outcome.
Expert Opinion
General market commentary: Buyback and burn headlines can support sentiment, but traders usually wait for the chart to confirm demand. A falling supply helps only if buyers keep showing up.
A 1H close above the channel's upper boundary with strong volume would be the first sign that demand is rising.
A close below 0.006252 would shift attention to 0.005996. Any Pump.fun price prediction 2026 stays conditional on those two events and on the direction of Bitcoin.
Disclaimer: This article is for information only and is not financial advice. PUMP could fall to 0.005773, about 8% below the current price, or lower if support fails. Burn figures are self-reported, and a bullish setup can fail within a few candles. Crypto prices are highly volatile, and you can lose part or all of your capital. Research independently before trading.











.webp)





