Pump.Fun Price Prediction: $0.0031 Support Or $0.0054 Breakout?

Pump.Fun launched its PUMP token in mid-2025 as the native asset behind its Solana-based meme coin creation platform.
It quickly became one of the most actively traded tokens tied to on-chain launchpad activity.
The project's fortunes have tracked the broader meme coin cycle closely since then, with sharp rallies followed by extended pullbacks.
This Pump.Fun price prediction looks at where $PUMP stands after a rough week.
Pump.Fun Price Today is $0.003599, and down 3.1% over the past 24 hours.
Price moved between $0.003517 and $0.00387 during that stretch. Market capitalization stood at $1.491 billion, keeping PUMP inside the top 60 tokens by size.
Live Market Data
Metric | Value |
Price | $0.003599 |
24h Change | -3.1% |
24h Range | $0.003517 - $0.00387 |
Market Cap | $1.491B |
Fully Diluted Valuation | $3.003B |
24h Trading Volume | $167.367M |
Total Value Locked | $329.696M |
Circulating Supply | 414.353B |
Total Supply | 834.485B |
Max Supply | 1T |
Source: Pump.Fun market data taken from CoinGecko, as of Sep 12, 2026. Figures may vary slightly across other tracking websites.
The circulating supply sits at roughly 41% of the maximum 1 trillion PUMP cap. The project's treasury still holds 216,800,000 $PUMP earmarked for future allocation.
That leaves meaningful future supply on the table, a factor worth weighing alongside any Pump.Fun price prediction 2026.
Liquidation Snapshot
Timeframe | Total Liquidated | Longs | Shorts |
1 Hour | $2.54K | $0 | $2.54K |
4 Hours | $16.95K | $12.21K | $4.74K |
12 Hours | $49.11K | $26.42K | $22.69K |
24 Hours | $1.64M | $1.27M | $367.32K |
Source: Liquidation Data Taken From CoinGlass, As of Sep 12, 2026.
The 24-hour figures show longs took the bulk of the damage, losing $1.27 million against just $367,320 on the short side.
That imbalance lines up with the day's 3.1% drop, since leveraged buyers were caught leaning the wrong way as price slipped toward support.
The shorter 1-hour and 4-hour windows show short positions taking more of the hit recently. That hints some of the selling pressure may already be running out of room.
Exchange Volume
Futures trading in $PUMP remains concentrated on a handful of major venues. Binance leads with $144.29 million in 24-hour futures volume, followed by OKX at $102.44 million and Hyperliquid at $58.48 million.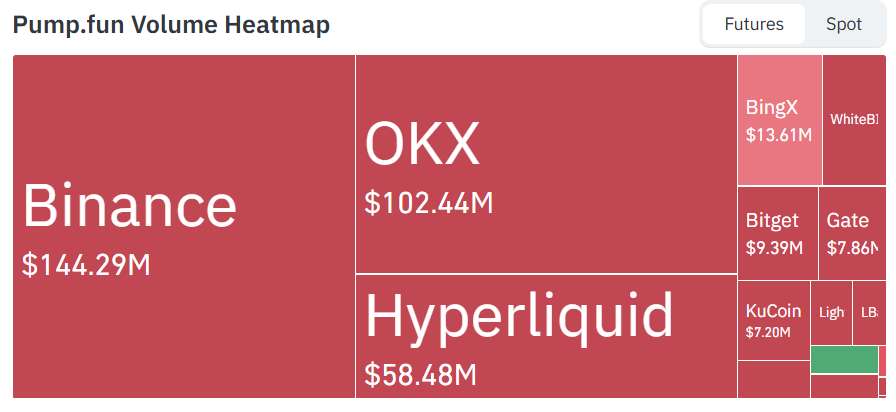
Source: Volume Heatmap Data Taken From CoinGlass, As of Sep 12, 2026.
Smaller contributions come from BingX at $13.61 million, Bitget at $9.39 million, Gate at $7.86 million, and KuCoin at $7.20 million.
Anyone following pump coin news today will notice this spread across exchanges points to broad-based derivatives interest rather than activity concentrated on a single platform.
Technical Analysis
$PUMP has been confined to a descending channel on the daily chart since the late-August high. Lower highs and lower lows continue to define the structure.
Price is now testing the lower boundary of that channel.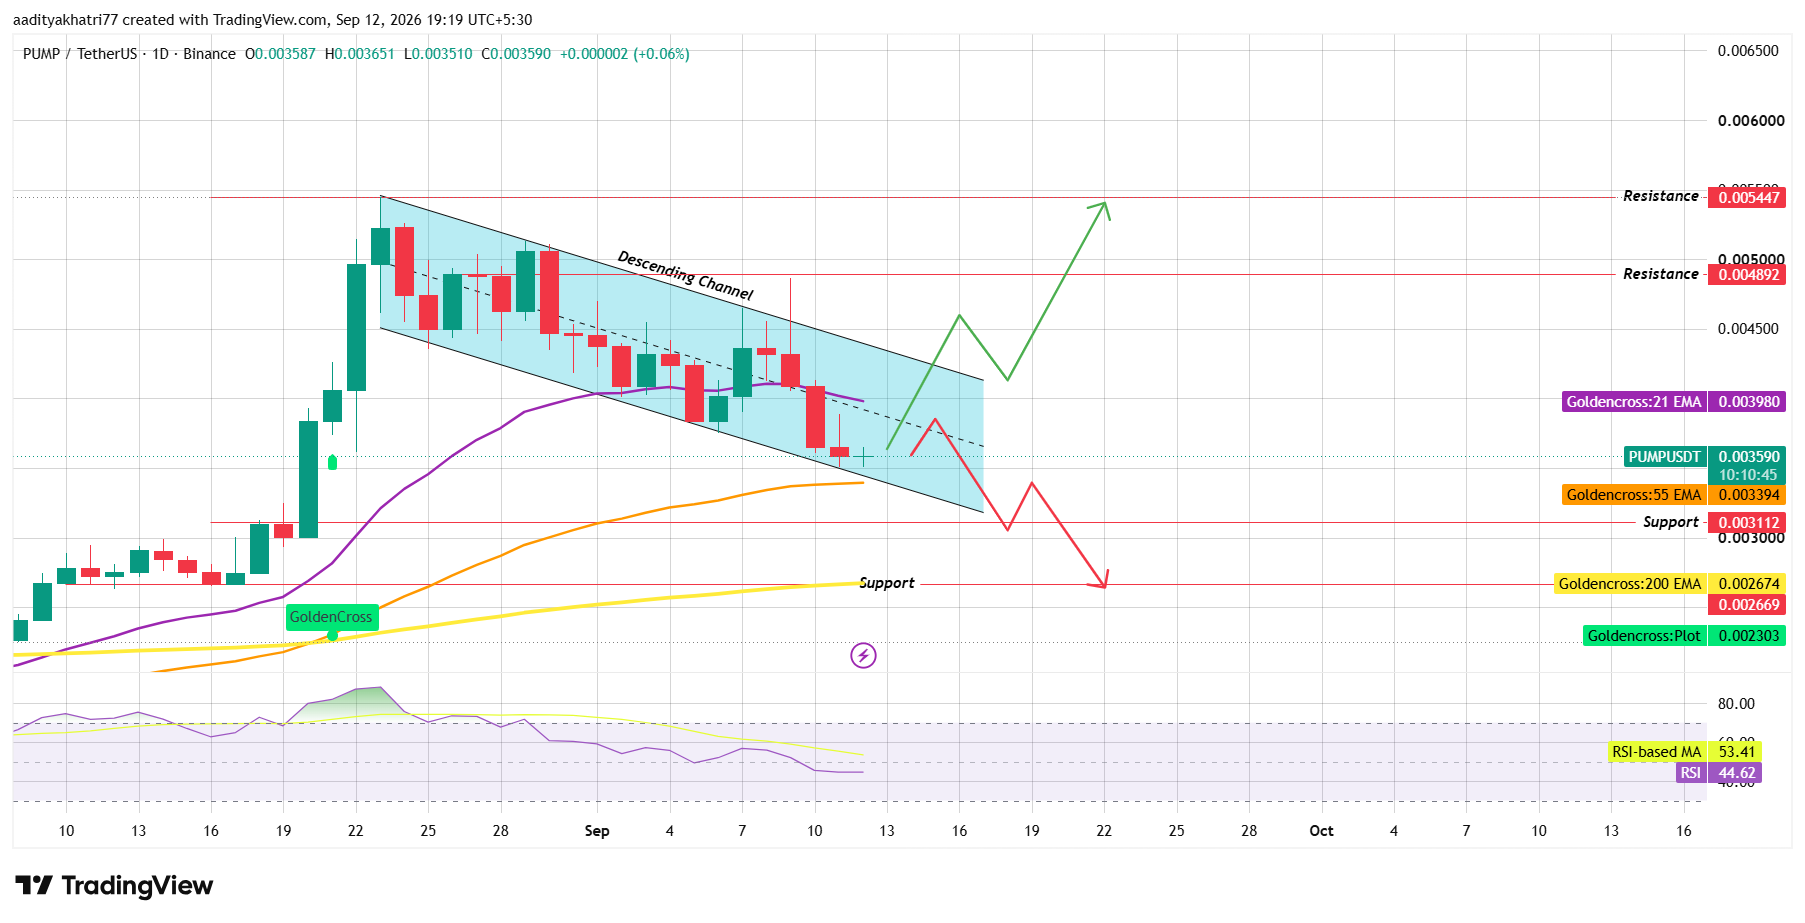
Source: Chart Taken From TradingView.
The RSI reads 44.62, sitting below its own 14-period moving average of 53.41. That points to soft momentum without confirming an oversold condition.
Price still trades above both the 55-period and 200-period exponential moving averages, a setup that followed a golden cross earlier in the chart's history.
Can $PUMP Bounce Off Support And Break The Channel?
A bounce from the current zone near $0.003112 would need to clear the descending channel's upper boundary, roughly $0.004892.
That break should come on a closed candle with volume above the recent average to be considered confirmed.
A successful break there would open room toward the next resistance band at $0.005447.
Holding above the 55 EMA at $0.003394 during any pullback would support this case. That average has acted as dynamic support through the recent decline.
What Happens If $PUMP Breaks Support?
If the $0.003112 floor gives way on a confirmed daily close, sellers would likely target the 200 EMA near $0.002674 next.
That average has not been tested since the golden cross formed. A break below that level would put the broader uptrend structure from earlier this year at risk.
It could also invite fresh short positioning, given how few buyers have defended lower zones during this cycle.
Support And Resistance Levels
Support | Resistance |
$0.003112 | $0.004892 |
$0.002674 | $0.005447 |
Bull, Base, And Bear Scenarios
Scenario | Setup | Level |
Bull | Bounce from support, channel breakout confirmed with volume | $0.005447 |
Base | Range-bound between channel boundaries, no confirmed break | $0.003112 - $0.004892 |
Bear | Confirmed breakdown below channel support | $0.002674 |
Pump.Fun Vs Bitcoin
PUMP's recent price action has loosely tracked Bitcoin's sideways consolidation. Volatility has been far greater, though, given PUMP's smaller market cap and heavier reliance on speculative, on-chain launch activity.
When Bitcoin cools, meme coin and launchpad-linked tokens like PUMP tend to see volume dry up first and recover last. That pattern partly explains the extended channel decline, even as broader crypto markets have stayed relatively calm.
Expert Opinion
Market analysts covering launchpad-linked tokens have generally noted that PUMP's trading activity tracks overall memecoin issuance volume on Solana closely. It does not appear to move purely on its own fundamentals.
Several technical analysts tracking pump coin news have pointed out that sustained volume above the 30-day average would be needed to validate any breakout attempt. Recent volume has looked thin during the channel's decline, which adds weight to that view.
Disclaimer: This Pump.Fun price prediction is for informational purposes only and should not be treated as financial advice. Cryptocurrency markets, including tokens like PUMP tied to on-chain launchpad activity, are highly volatile, and any price target discussed carries meaningful downside risk. Actual outcomes may differ substantially from the scenarios outlined above, and readers should conduct independent research before making any investment decisions.









.jpg)








