Pump.Fun Price Prediction: Is $0.0048 Within Reach for PUMP?


This Pump.Fun Price Prediction looks at whether PUMP can push through resistance toward $0.0048, or whether the recent surge runs out of steam.
With shorts taking a heavy hit over the past day and price still respecting its channel structure, traders watching the pump price level closely are focused on this breakout test.
Pump.Fun built its reputation as a launchpad platform for meme tokens on Solana before introducing its own native token, $PUMP, which quickly became one of the more actively traded assets tied to the platform's ecosystem.
Its total value locked and trading volume have made it a closely watched name among traders following new-generation token launches.
PUMP is priced at $0.004236, up 7.7% over the past 24 hours.
The 24-hour range has held between $0.003839 and $0.004327, and this Pump.Fun Price Today snapshot reflects data current as of September 18, 2026.
Live Market Data
Metric | Value |
Price | $0.004236 |
24h Change | +7.7% |
24h Range | $0.003839 - $0.004327 |
Market Cap | $1.981B |
Outstanding Token Value | $2.514B |
Fully Diluted Valuation | $3.529B |
Total Value Locked (TVL) | $342.242M |
24h Trading Volume | $185.559M |
Circulating Supply | 467.853B |
Total Supply | 833.358B |
Max Supply | 1T |
Source: $PUMP market data taken from CoinGecko, as of Sep 18, 2026. Figures may vary slightly across other tracking websites.
Volume Exchange
Trading activity is concentrated on major exchanges, with Binance leading at $160.40M and OKX following at $105.90M. Hyperliquid contributes $52.57M, while BingX, KuCoin, Bitget, and Gate round out the remaining volume across smaller platforms.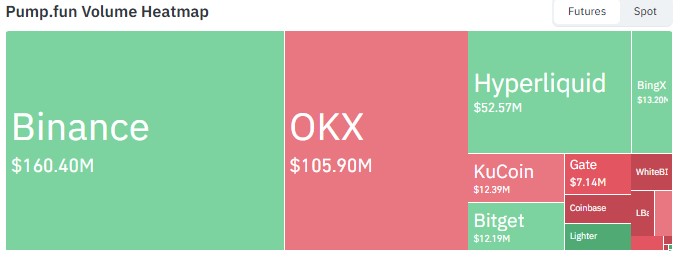
Source: Volume Heatmap Data Taken From CoinGlass, As of Sept 18, 2026.
Liquidation Snapshot
Timeframe | Total Liquidated | Longs | Shorts |
1h | $72.50 | $12.65 | $59.85 |
4h | $70.24K | $41.98K | $28.26K |
12h | $2.36M | $53.94K | $2.31M |
24h | $2.81M | $126.59K | $2.69M |
Source: Liquidation Data Taken From CoinGlass, As of Sept 18, 2026.
Short positions have taken the overwhelming majority of losses over the past 24 hours, with $2.69M in shorts liquidated against just $126.59K in longs.
This kind of imbalance typically reflects traders caught off guard by a fast move higher, and continued short covering could add further fuel if $PUMP pushes toward resistance.
Technical Analysis for PUMP
The hourly chart shows $PUMP trading inside a well-formed ascending channel, with price currently testing the area near its upper boundary after a strong run. 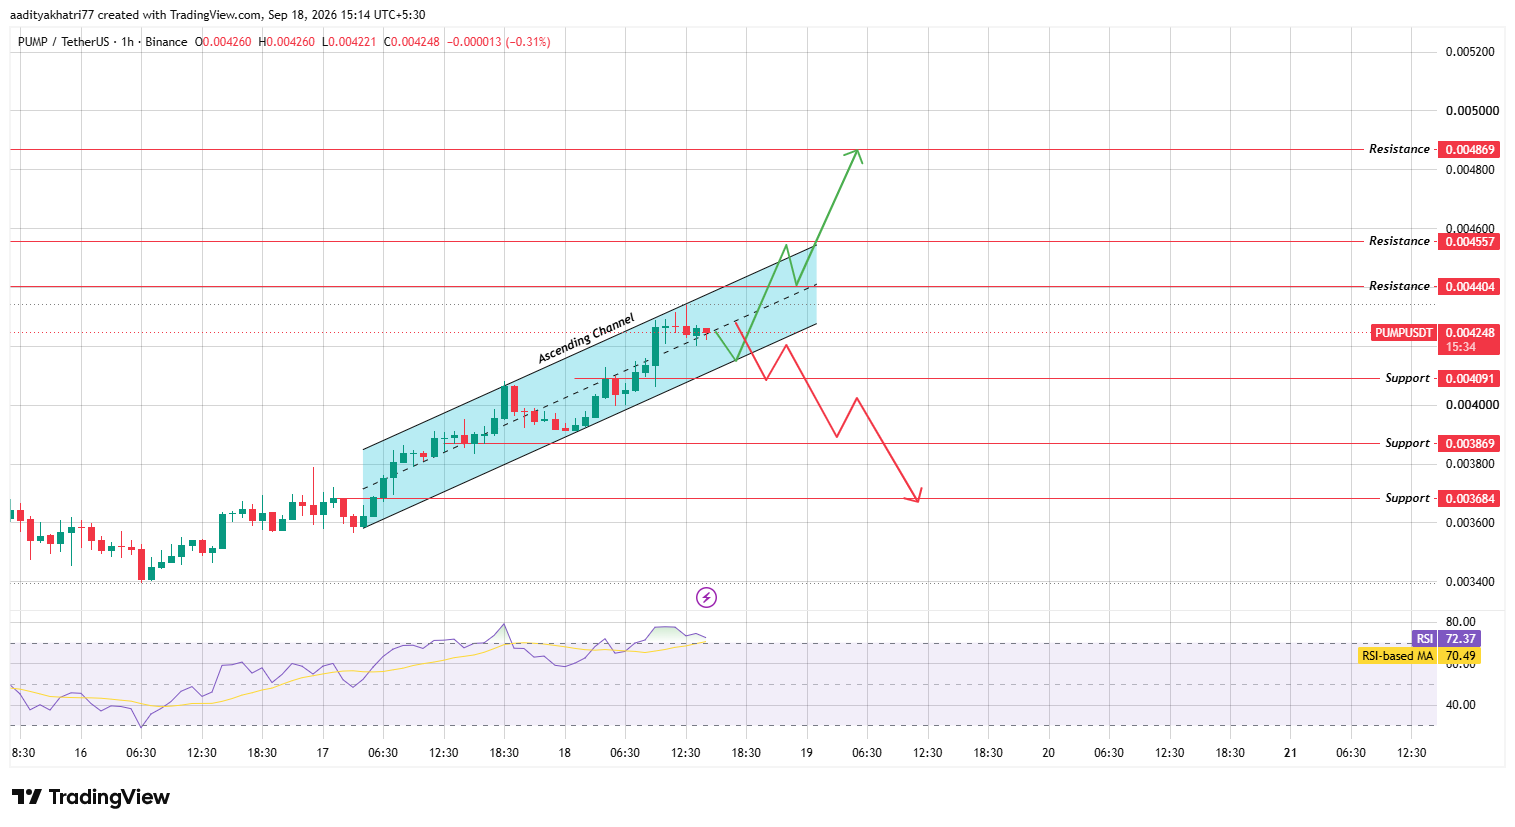
Source: Chart taken from TradingView, as of Sep 18, 2026
RSI sits at 72.37, above its moving average of 70.49, indicating strong momentum that is edging into overbought territory.
This pump technical analysis suggests buyers remain in control, though a cooldown or consolidation phase is not unusual at these RSI levels.
Can $PUMP Break Toward Higher Resistance?
If volume increases and price clears $0.004404, the next resistance sits at $0.004557.
A confirmed break above the channel's upper boundary would open the path toward $0.004869, the level referenced in this Pump.Fun Price Prediction's headline scenario.
Sustained volume would be needed to confirm this move rather than a brief spike through resistance.
What Happens If $PUMP Breaks the Lower Boundary?
If the price pulls back toward the channel's lower boundary and breaks below $0.004091, the setup turns bearish.
A deeper decline could test $0.003869, and a more extended pullback may expose $0.003684 if selling pressure builds.
Support and Resistance Levels
Support | Resistance |
$0.004091 | $0.004404 |
$0.003869 | $0.004557 |
$0.003684 | $0.004869 |
Bull, Base, and Bear Scenarios
Scenario | Setup | Level |
Bull | Channel breakout with volume | $0.004404 → $0.004869 |
Base | Continued range near channel top | $0.0041 - $0.0044 |
Bear | Lower boundary break, channel breakdown | $0.004091 → $0.003684 |
Methodology
This Pump.Fun Price Prediction 2026 is based on hourly chart analysis using ascending channel mapping, support and resistance identification, and RSI momentum readings, cross-checked against live market data as of September 18, 2026.
Expert Opinion
Analysts tracking PUMP's ascending channel note that a sharp short squeeze combined with sustained channel structure often signals continued bullish pressure, though an RSI reading above 70 warrants some caution around a short-term pullback before any fresh breakout attempt.
Disclaimer: This Pump.Fun Price Prediction is based on technical chart analysis and current market data and should not be treated as financial advice. Cryptocurrency markets are highly volatile, and readers should conduct their own research and consider their risk tolerance before making any investment decisions.


















