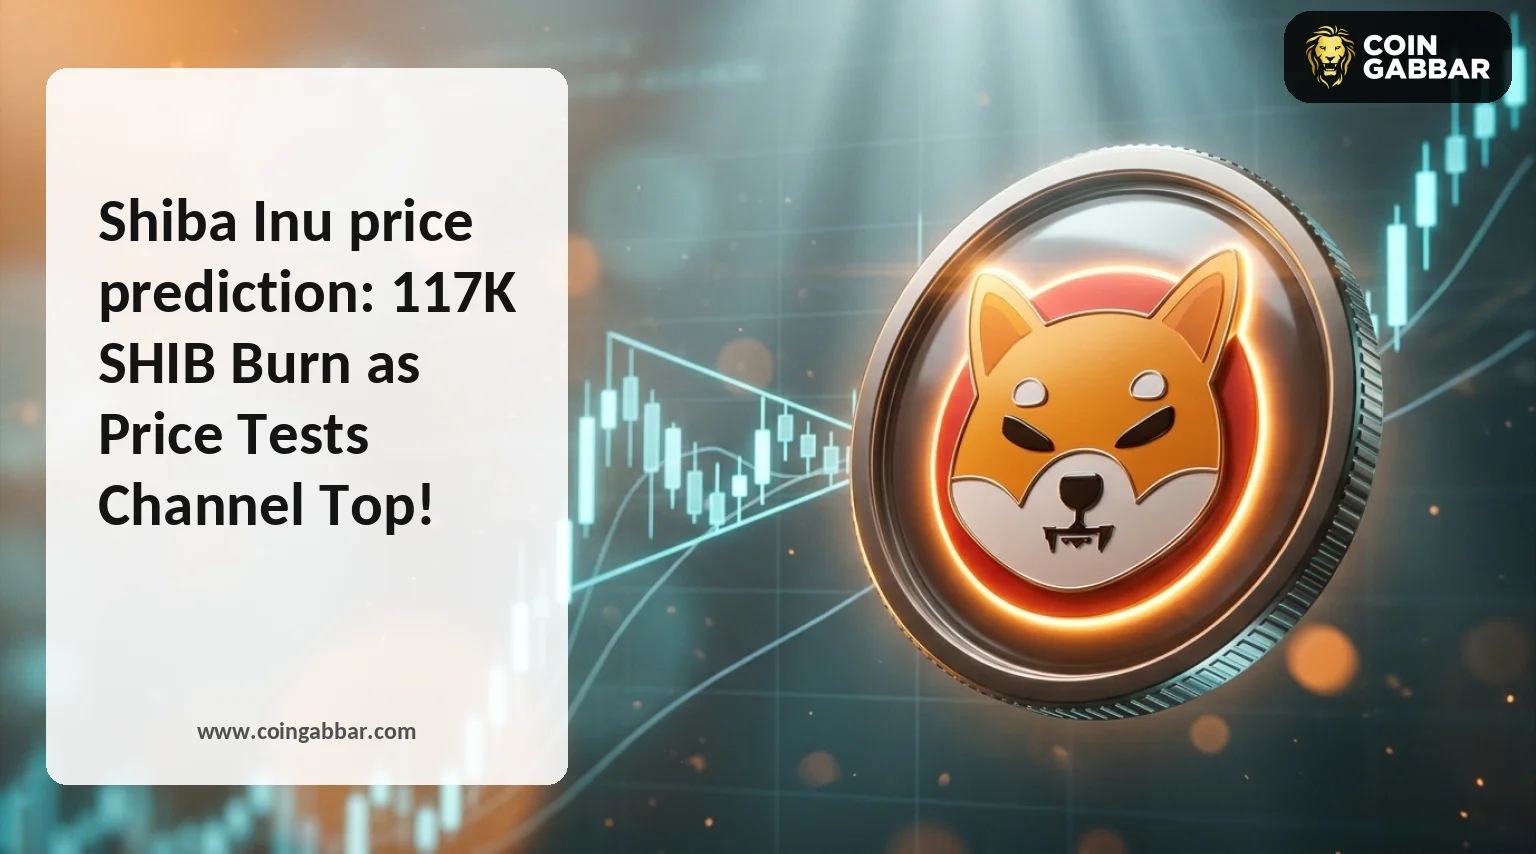
Shiba Inu price prediction: 117K SHIB Burn as Price Tests Channel Top!

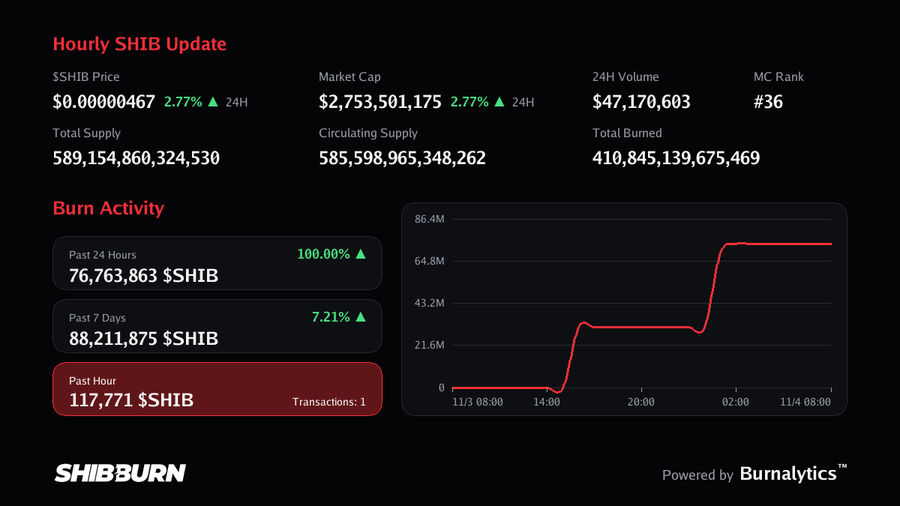
Shiba Inu just woke up on the charts, and everyone wants to know why. After weeks of sliding, SHIB ticked higher today while Shibburn posted that 117,771 SHIB were burned in the past hour, all in one transaction.
So does the Shiba Inu price prediction turn bullish? We break down what the burn really means, who got liquidated and the levels that decide the next move.
Shiba Inu is a dog-themed meme token on Ethereum, according to the project's own materials, with one of the biggest communities in crypto. Stay till the end, because one price level matters more than everything else.
Why is Shiba Inu price up today?
The Shiba Inu price today is up 3% to $0.000004710 in 24 hours, closely tracking a broader crypto market rebound primarily driven by a macro-driven relief rally after the U.S. midterm elections.
Reason: Beta-driven move with Bitcoin, fueled by reduced political uncertainty post-election.
SHIB Price Prediction: Burn Update and Liquidation Data
Shibburn reported 117,771 SHIB burned in one transaction. At today's price, that's about $0.55, or roughly 0.00000002% of the circulating supply. Burns shrink supply, but one this small can't move a market. Buyers do that.
Source: Data From X
Liquidations, which are forced closings of leveraged trades, tell a similar story. Over 24 hours they totaled $24.46K: $19.13K on longs (about 78%) and $5.33K on shorts.
Most of it, $22.95K, came in the last 12 hours, which fits with today's dip to $0.000004479 before the bounce.
The totals are small, so futures aren't driving the price right now. Spot buying and selling are.
Source: Data From CoinGlass
Shiba Inu Price Prediction Chart Analysis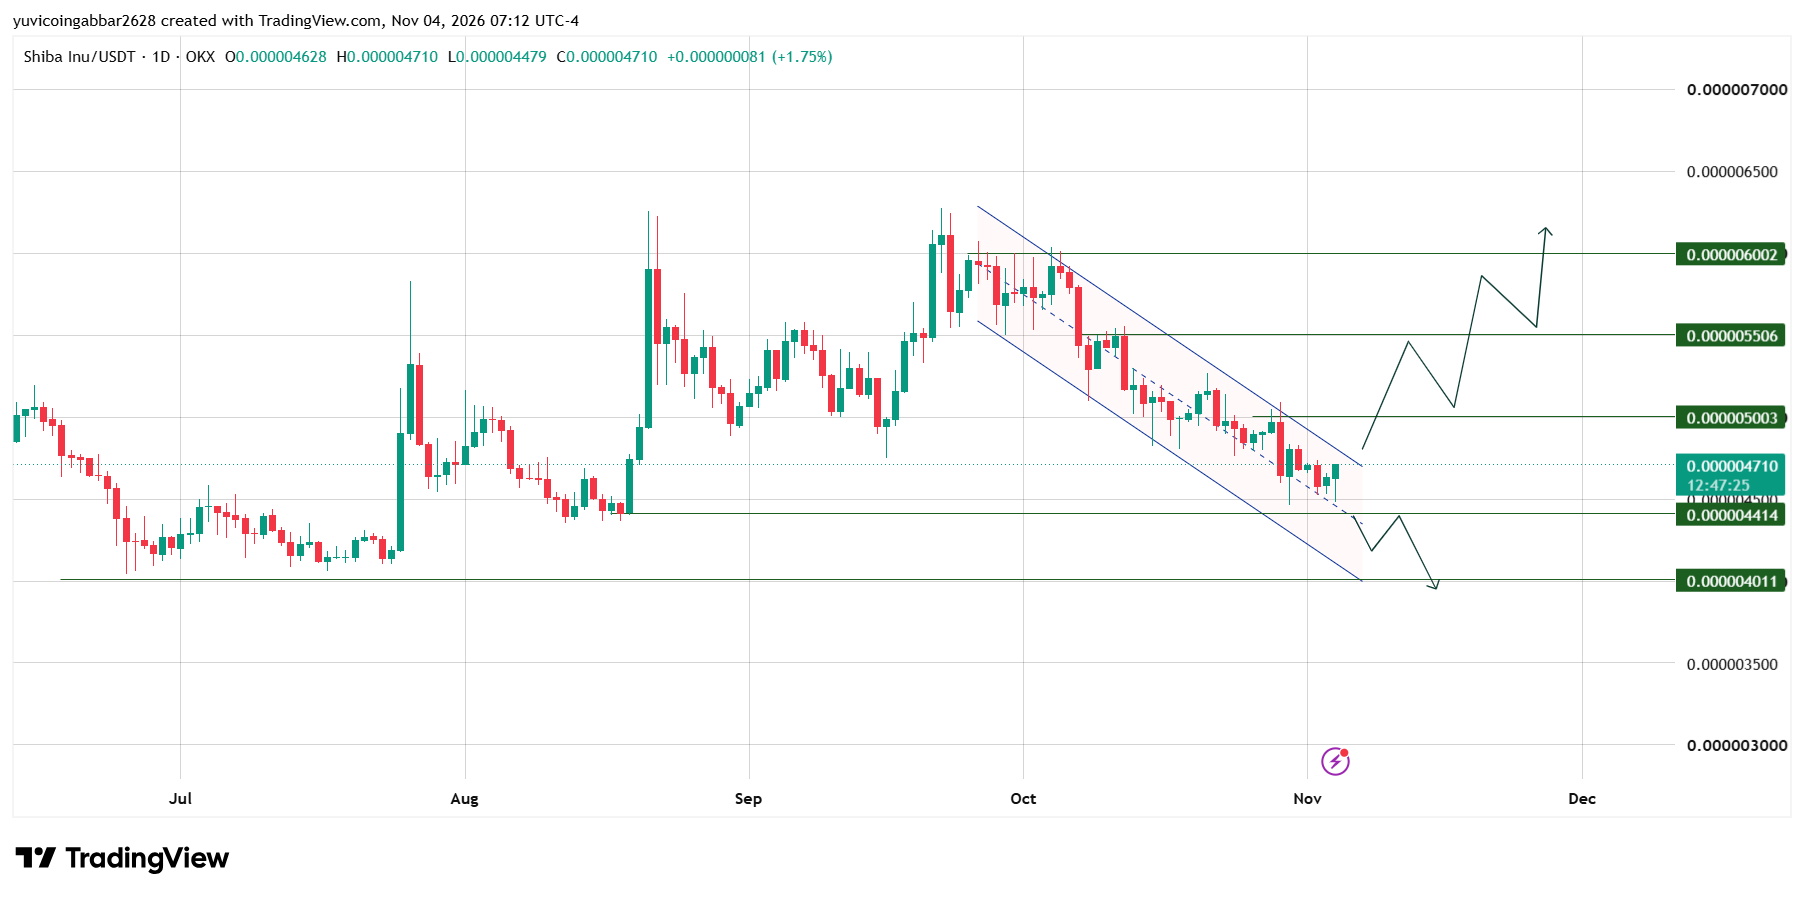
SHIB has made lower highs and lower lows for about six weeks. Today's candle opened at $0.000004628, dipped to $0.000004479 and sits near $0.000004710, just under the channel's upper line.
The price was pushed back from that line before, so today's bounce is a test, not a breakout. For more on how we track SHIB, see our SHIB price analysis
Level | Price | From now | Why it matters |
Resistance 3 | $0.000006002 | +27.4% | Early October highs |
Resistance 2 | $0.000005506 | +16.9% | Mid-October rejection zone |
Resistance 1 | $0.000005003 | +6.2% | Late October high, above the channel |
Support 1 | $0.000004414 | -6.3% | August lows |
Support 2 | $0.000004011 | -14.8% | July lows |
SHIB Price Prediction: Bull Case vs Bear Case
Bull Case: A Close Above $0.000005003
If $SHIB closes a daily candle above the channel and $0.000005003, the falling pattern breaks and $0.000005506 comes into view.
Bear Case: A Close Below $0.000004414
If sellers defend the channel top, $SHIB can slide back toward $0.000004414. A close below it opens $0.000004011.
Can $SHIB Reach $0.000006002?
It's a long road. $SHIB first has to clear $0.000005003 (+6.2%), then $0.000005506 (+16.9%), and only then $0.000006002 (+27.4%).
Each one is an old rejection zone, so every step needs a daily close and rising volume, not a quick spike.
$SHIB vs Bitcoin: Why the Bitcoin Price Prediction Matters
Meme coins like $SHIB often move with Bitcoin, just with bigger swings. If the Bitcoin price prediction turns weaker, a channel breakdown in $SHIB gets more likely. We didn't use Bitcoin price data here, so check its chart before acting.
SHIB Price Prediction 2026 Table
These are scenario zones from the chart, not targets or promises. Each zone uses the nearest past reaction levels.
Case | Zone | What has to happen |
Bear | $0.000004011 to $0.000004414 | Daily close below $0.000004414 |
Base | $0.000004414 to $0.000005003 | $SHIB stays inside the channel |
Bull | $0.000005506 to $0.000006002 | Channel breaks and $0.000005003 holds as support |
SHIB Price Prediction Expert View
$SHIB is at the top of its channel, and that's where moves get decided. A close above $0.000005003 matters far more than any single burn post. Until then, patience beats guessing.
Disclaimer
This is a chart read, not financial advice. Meme coins can swing hard in a single day, so only risk what you can afford to lose and do your own research.