Shiba Inu Price Prediction: SHIB's Channel Breakout Trap! What’s Next?


SHIB pushed above its falling channel this week. Did the breakout hold? No. A long red candle dropped price back inside the channel. Longs took about 89% of the $579.40K liquidated in 24 hours. This Shiba Inu Price Prediction covers the liquidations, a post on SHIB's three tokens and a step-by-step chart read.
Market data checked on October 30, 2026, at 14:42 IST.
Why is SHIB’s price down today?
The Shiba Inu price today is down 3% to $0.000004684 in 24 hours, closely tracking a broader market decline led by Bitcoin's 3.24% drop. The move was primarily driven by a derivatives-led liquidation cascade, which amplified selling pressure amid thin organic demand for the meme coin.
Primary reason: A $20 million $SHIB liquidation wave forced leveraged long positions to unwind, creating immediate selling pressure.
Secondary reasons: $SHIB moved in lockstep with a falling crypto market, and underlying weakness in Shibarium activity contributed to the bearish sentiment.
Shiba Inu News Today: The Three Tokens Behind $SHIB
Shiba Inu runs on three tokens. It says $SHIB launched in 2020 with a supply of one quadrillion, which is 1,000 trillion. LEASH began with a rebase that was later dropped. A rebase changes the token supply in every holder's wallet automatically.
BONE is the governance token for votes in the Shiba Inu DOO, the term the post uses.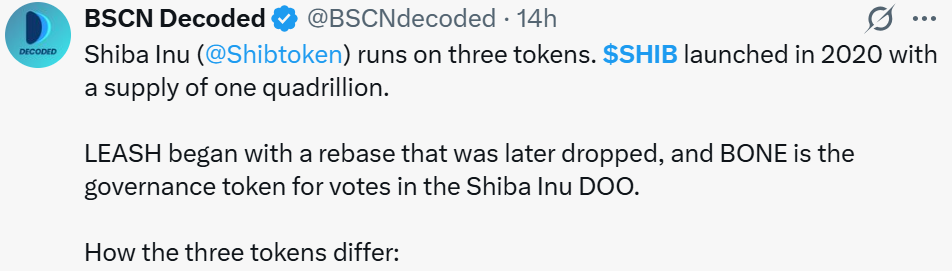
Source: Data From X
The comparison image the post promises was not shown, and it makes no price claim. CoinGabbar could not verify the details.
SHIB News: $SHIB Liquidation Data
A liquidation happens when an exchange force-closes a leveraged trade because the trader can no longer cover losses. Longs bet on a rise, and shorts bet on a fall.
| Window | Total Liquidated | Long | Short |
| 12h | $231.75K | $227.42K | $4.33K |
| 24h | $579.40K | $518.19K | $61.21K |
Source: Data From CoinGlass
Longs took about 89% of the $579.40K liquidated over 24 hours and about 98% of the 12-hour total. This fits the drop from the channel's upper boundary.
Shiba Inu Price Prediction: Technical Analysis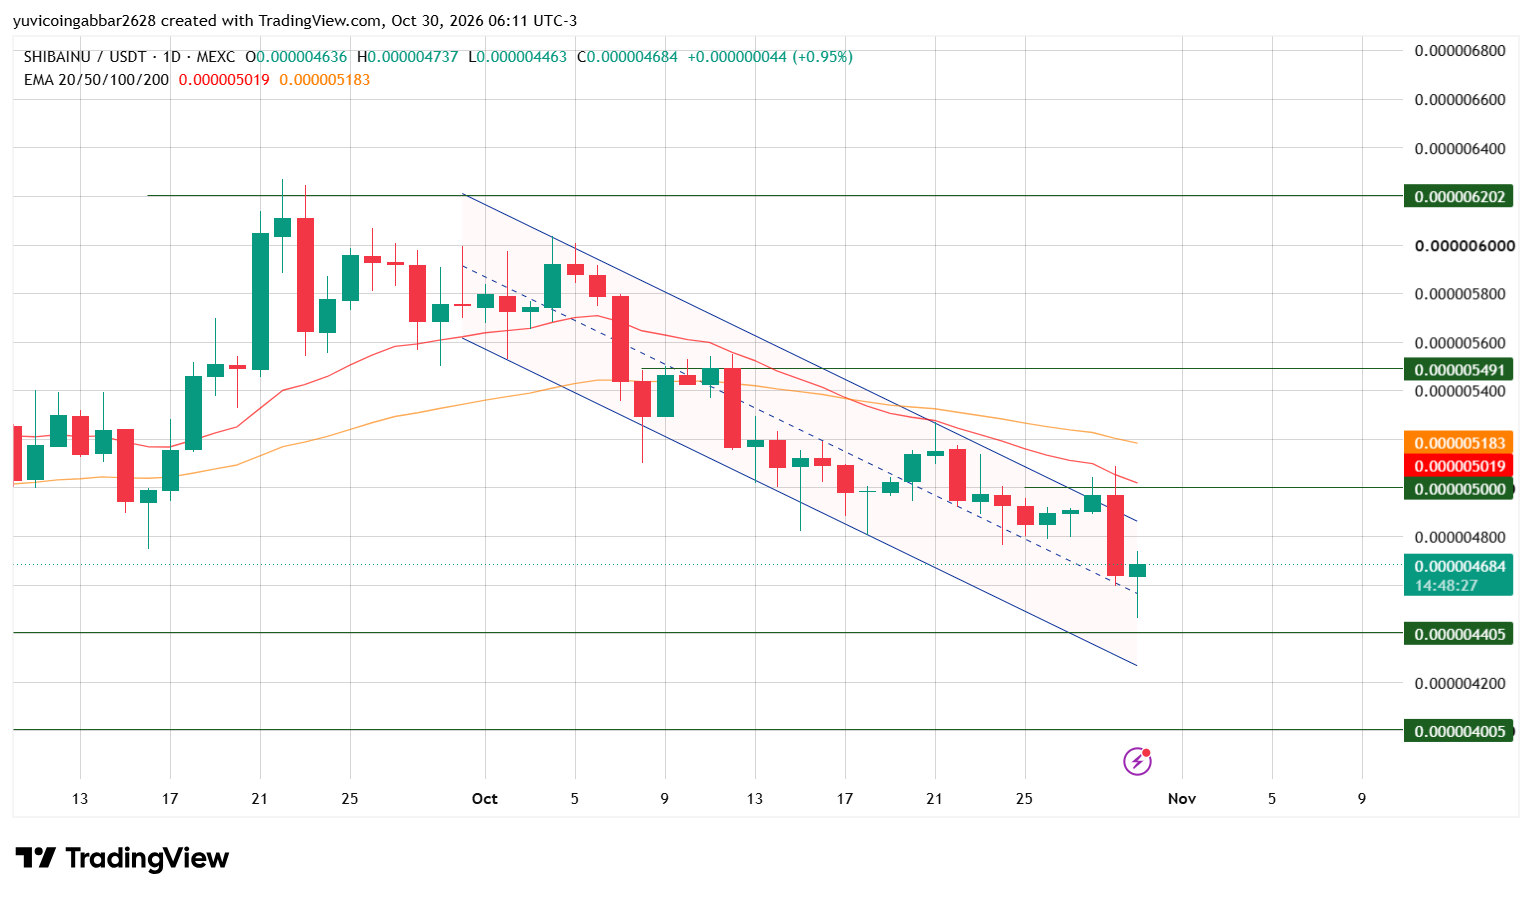
$SHIB peaked near $0.0000062 in late September, then moved lower inside a falling channel, a pair of downward-sloping boundaries that hold price in a range.
Recently, the price poked above the upper boundary, but the move did not last. A long red candle followed and closed near today's open of $0.000004636, back inside the channel.
Today SHIB fell to $0.000004463, under the $0.000004800 level, then bounced to $0.000004684. The low held above $0.000004405. The candle was still open, so the close can change.
| EMA | Value | Position vs Price |
| EMA 20 (red) | $0.000005019 | Above price, about 7.2% |
| EMA 50 (orange) | $0.000005183 | Above price, about 10.7% |
Shiba Inu Forecast: Support and Resistance Levels
| Type | Level |
| Highest marked level | $0.000006202 |
| Resistance 3 | $0.000005491 |
| Resistance 2 | $0.000005000 |
| Resistance 1 | $0.000004800 |
| Immediate support | $0.000004405 |
| Deeper support | $0.000004005 |
Bull case: A daily close above $0.000004800, then $0.000005000, about 7% higher, would put the 20 EMA and 50 EMA in view.
Bear case: If SHIB closes below $0.000004405, about 6% lower, the price could slide about 14% toward $0.000004005.
SHIB Scenarios and Invalidation (October 30, 2026)
| Scenario | Trigger | Likely Outcome | Invalidation |
| Bull | Close above $0.000005000 | Move toward the 20 EMA at $0.000005019, then the 50 EMA at $0.000005183 | Close below $0.000004405 |
| Base | Range of $0.000004405 to $0.000004800 | Sideways inside the channel | Break of either level |
| Bear | Close below $0.000004405 | Slide toward $0.000004005 | Close back above $0.000004405 |
SHIB Prediction: Can Shiba Inu Reach $0.000006202?
It would take a gain of about 32% from $0.000004684. Any SHIB Forecast toward that level needs more than a token explainer, since $SHIB must clear both EMAs and $0.000005491 first.
Shiba Inu Price Prediction: CoinGabbar Technical Read
The breakout noted earlier this week has failed for now. Price is back inside the channel and under both EMAs, and the 20 EMA is below the 50 EMA.
The level to watch is $0.000004405. A daily close below it would open $0.000004005, while a close above $0.000005000 would be the first real sign of strength.
Disclaimer
This article is for informational purposes only and isn't financial advice. Crypto markets are volatile. Always do your own research before making any trading decisions involving SHIB.