Shiba Inu Price Prediction: SHIB Slips Under 200 EMA, What Next?


Bears grabbed SHIB fast. As of 05:05 UTC on October 7, 2026, this Shiba Inu price prediction starts with a token at $0.000005538, down 5.09% in 24 hours.
Shiba Inu price today sits just under the 200 EMA. Plenty of crypto price predictions cover other coins, but SHIB price damage here has its own causes.
Shiba Inu Price Prediction: What Is Happening Now?
Three data feeds agree on direction, and it's down.
Current Price and 24H Performance
CoinMarketCap data ranks SHIB at #30, with a 24-hour range of $0.000005497 to $0.000005914. Sellers owned the session. That's a wide swing for a top-30 coin.
Trading Volume and Market Cap
Spot volume hit $79M, up 4.97%, against a market cap of $3.26B. Rising volume during a falling price is the wrong mix for bulls. Coinglass futures data shows $48.42M in futures volume against $26.43M in spot. Derivatives traders are steering this move.
Why Is Shiba Inu Moving Today?
SHIB just broke down. Fast. One four-hour candle dumped through $0.00000557, the 200 EMA, and tagged $0.00000551. Longs got flushed. Dip buyers showed up late. Earlier Solana access news didn't hold the price up either.
Futures Liquidations and Exchange Flow
Liquidations hit $285.26K over 24 hours. Shorts lost just $14.37K, while longs lost. $270.89K.
OKX and LBank led futures volume at $12.74M and $12.60M. Fresh exchange listing news can add depth for later. OKX also shows a long-to-short account ratio of 3.04. That's a crowded bet, and crowded bets hurt when price slips.
Supply and Burn Rate
Circulating supply is 589.23T SHIB, with a max supply of 589.55T. The SHIB burn rate grabbed attention after U.Today reported 297 million tokens burned, up 6847%. That's about $1,645 at current prices. Against 589.23T tokens, it's a rounding error. Nothing more.
Holders and Burn Wallet
Etherscan holder data lists 1,697,896 holders on Ethereum, while CoinMarketCap counts 3.09M across chains. The top 100 wallets hold 82.81%. One burn wallet alone holds 41.04%. Those tokens are dead, yet they inflate the concentration math.
Whale Share of Supply
Whales make up 0.05% of holders but control 94.73% of market cap. That tier includes the burn wallet, so real selling power is likely smaller. And earlier, whale buying analysis covered why SHIB stayed weak anyway. So who's left to buy?
Shiba Inu Technical Analysis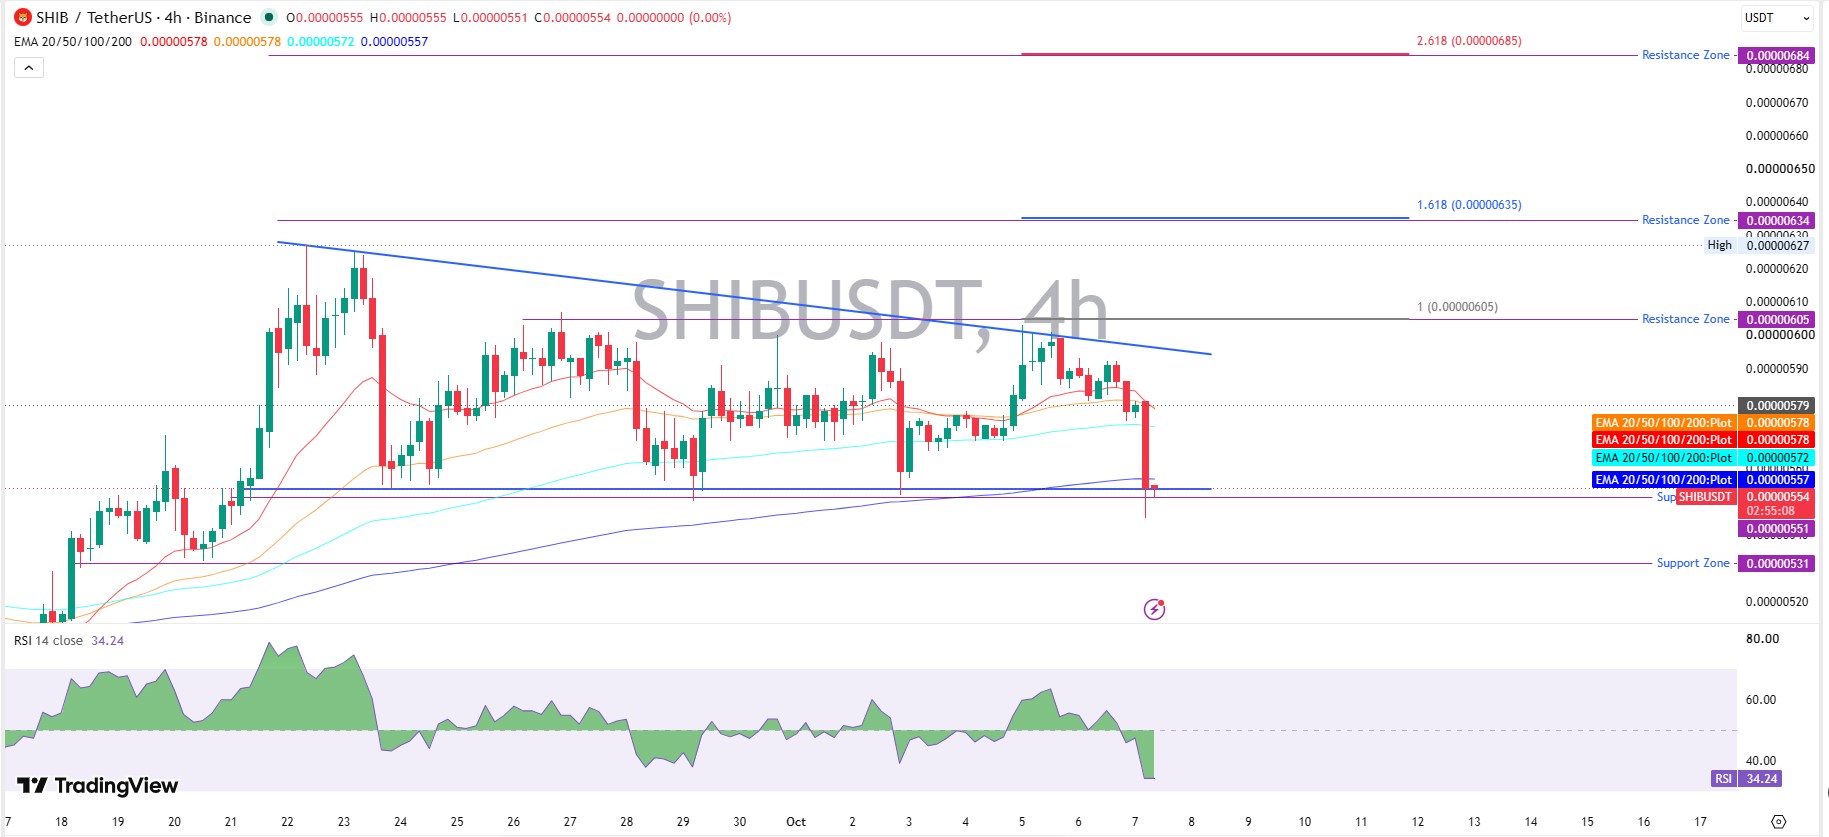
SHIB technical analysis on the four-hour chart tilts bearish. Indicators are evidence, not guarantees.
RSI and EMA Readings
RSI measures momentum from 0 to 100, and the TradingView SHIBUSDT chart shows 34.24. Near oversold, but not there.
EMA means exponential moving average, a line that weights recent trades more. Price at $0.00000554 trades under the 200 EMA at $0.00000557, the 100 EMA at $0.00000572, and the 20 and 50 EMAs at $0.00000578.
Key Support Levels
SHIB support and resistance starts below. The first floor is $0.00000551, about 0.5% lower, and the next is $0.00000531, roughly 4.2% down. Buyers have one job right now, which is to defend. $0.00000551, nothing else.
A prior Wolfe Wave setup argued for upside, a view this breakdown challenges. If sellers push through $0.00000531, then well. No marked floor sits below on the chart.
Key Resistance Levels
A bounce first has to reclaim $0.00000578. Then comes $0.00000605, about 9.2% higher, and $0.00000634, near 14.4% up.
Past that, $0.00000684. A descending trendline from the September 22 high adds pressure overhead, and earlier Solana launch breakout levels mapped a different zone.
Shiba Inu Price Prediction for October 2026
This Shiba Inu price forecast covers the next two to four weeks. Each scenario carries an invalidation.
Bull Case
Bulls need a pushback above $0.00000578 on rising volume. That opens $0.00000605, then $0.00000634 as a possible SHIB price target. Invalidation is another rejection at the descending trendline. Meme coin news could add fuel, but price must lead.
Base Case
A range between $0.00000531 and $0.00000578 seems likeliest. Bearish call? Yes. Actually, scratch that: bearish for now, not broken, since the 30-day move is still +0.34%. Attention could drift toward AI crypto news while SHIB chops sideways.
Bear Case
A SHIB bearish outlook takes hold if $0.00000531 breaks on heavy volume. Losses could stretch fast with no marked floor underneath. Invalidation is a quick reclaim of the 200 EMA. Fresh meme coin presales can also drain attention.
What Could Change the Outlook?
Headline risk cuts both ways. An official Shib post on October 6 pitched Shibarium, ShibaSwap, DeFi, NFTs, and gaming, yet the price still fell. Narrative isn't demand. Only volume proves that.
Shiba Inu Long-Term Price Outlook
Longer windows are mixed. SHIB gained 29.49% over 90 days, lost 6.02% over 180 days, and sits 19.69% lower year to date. One-year performance is -56.88%, and price is 93.74% below the $0.00008845 peak from October 28, 2021. Reaching $0.00001 would take roughly an 81% gain, so upcoming coin events are worth tracking.
Risks That Could Change the Shiba Inu Price Prediction
Crowded longs, thin dip buying, and whale concentration are the main threats. Capital also drifts toward new crypto airdrops and fresh launches. Short-term bounces can fail quickly. That's the risk.
Final Takeaway
This Shiba Inu price prediction stays bearish while the price trades under $0.00000557. Reclaiming $0.00000578 would soften that view. Until then, rallies deserve suspicion.
Disclaimer: This article is for information only and isn't financial advice. Crypto prices swing hard, scenarios can fail, and capital can be lost. Research independently before trading. Data sources: CoinMarketCap, Coinglass, Etherscan, and TradingView, as of 05:05 UTC on October 7, 2026.












.webp)




