Shiba Inu Price Prediction: Wolfe Wave Flashes Upside After 3.4% Drop

The Shiba Inu price prediction October 2026 depends on one question: can SHIB hold its triangle support and break the falling trendline?
Price is down 3.4% on the day, but a Wolfe wave on the chart still points to an upside move if volume arrives.
Shiba Inu Coin launched in August 2020 under the anonymous founder Ryoshi. It was created as a Dogecoin-inspired meme coin on Ethereum and has since grown into one of the largest meme coins by market value.
For the latest Shiba Inu price today, SHIB trades at $0.000005686, down 3.4% over 24 hours. It ranks #35 by market cap at $3.35B, and its 24-hour range runs from $0.000005534 to $0.000005970.
Shiba Inu Coin Live Data
Metric | Value |
Price | $0.00000568 |
24h Change | -3.4% |
24h Range | $0.00000553 - $0.00000597 |
Market Cap | $3.35B |
Source: market data taken from CoinGecko, as of Oct 3, 2026. Figures may vary slightly across other tracking websites.
Shiba Inu (SHIB) News Today
The latest Shiba Inu news is about holder growth. BSCN reported that SHIB's holder count has grown by about 4,770 addresses in the past two weeks.
The post adds that the community is getting close to 1.7 million holders.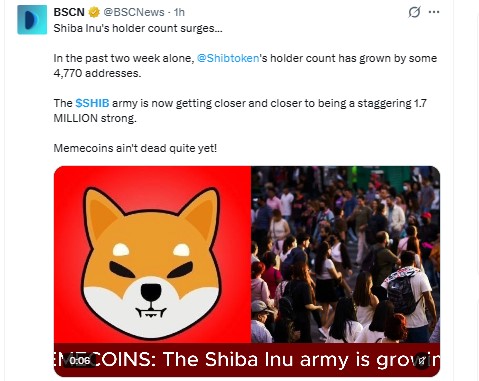
Source: Data taken from @BSCNews, X Account, as of Oct 3, 2026
The figure comes from a social media post and does not name its on-chain data source, so it cannot be independently verified here.
Rising holder counts can point to growing interest, but they do not show how much money is coming in. They also sit beside a 3.4% daily drop, so traders should treat the post as a headline, not confirmed demand.
Shiba Inu (SHIB) Technical Analysis
This Shiba Inu technical analysis uses the 4-hour (4H) SHIBUSDT chart on Binance, captured at 11:53 IST on October 3, 2026.
The current 4H candle was still open at capture and closes at about 13:30 IST (08:00 UTC).
Price is trading inside a symmetrical triangle. A falling trendline from the September 22 and 23 highs presses down from above, while a rising trendline from the September 20 low supports price from below.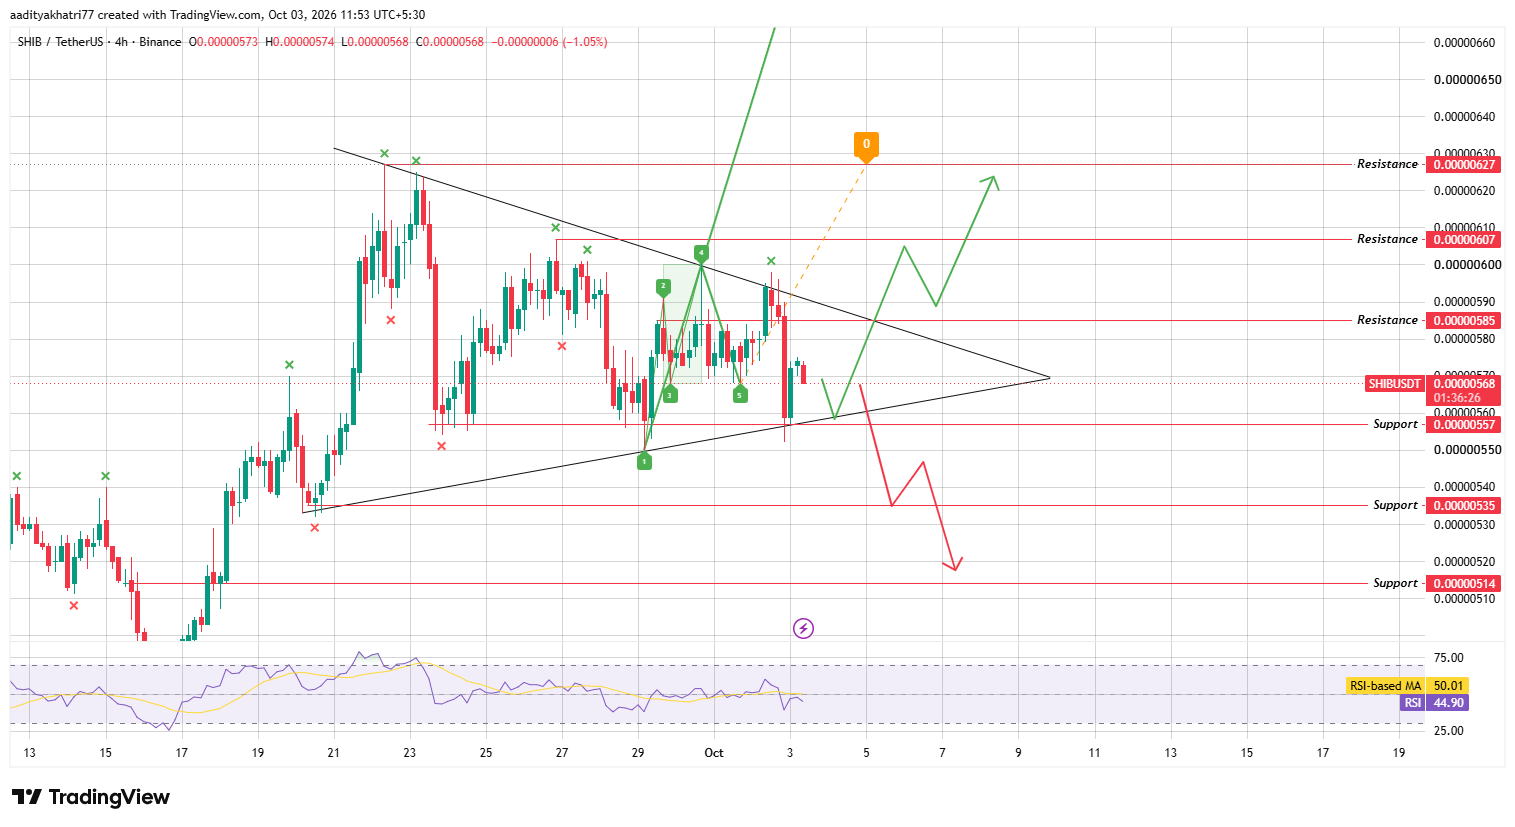
Source: Chart taken from TradingView, Binance SHIBUSDT, October 3, 2026
The two lines are squeezing the range, which usually ends in a sharp move.
On October 2, $SHIB was rejected near the falling trendline and then dropped. The sell-off was slightly under the $0.00000557 support, and the price recovered above it.
The chart also shows a Wolfe wave pattern. Its five points have formed along the triangle, and the projected target line leans upward.
In this pattern, a bounce from the lower trendline and a break above the falling trendline would point toward the upper resistance zone near $0.00000627. That path is valid only if volume confirms the move.
The RSI reads 44.90 and sits below its moving average at 50.01. That shows soft momentum with a slight lean toward caution, not an extended move in either direction.
Can Shiba Inu Push Toward Higher Resistance?
The bullish case starts with SHIB holding the $0.00000557 support and bouncing. If buyers push price through the falling trendline, the move can extend to $0.00000585, about 3.0% above the current level.
A real breakout needs more than a brief touch. A 4H candle should close above both the trendline and $0.00000585, and volume should be at least 1.5 times the average of the previous 20 candles.
Once that happens, the next stop is $0.00000607, roughly 6.8% higher. A further push could then aim for $0.00000627, a gain near 10.4%. This is also the zone where the Wolfe wave target sits.
A close on weaker volume would leave the move open to a fade, so the signal is not confirmed until the volume condition is met.
What Happens If Shiba Inu Gets Rejected?
The weaker path begins with a rejection at the falling trendline. If the price turns down from there, it would slide back toward the $0.00000557 support, about 2.0% below the current level.
That floor has been tested several times over the past two weeks, so it is the line to watch.
A 4H close below it, with the same 1.5x volume threshold, would confirm a breakdown. A breakdown would also cancel the Wolfe wave setup.
The next support levels are $0.00000535 and $0.00000514. The last one is about 9.3% under the current price. The soft RSI reading gives this setup a cautious lean until a trendline break proves otherwise.
Price Levels to Watch
Support | Resistance |
$0.00000557 | $0.00000585 |
$0.00000535 | $0.00000607 |
$0.00000514 | $0.00000627 |
Bull, Base, and Bear Scenarios
Scenario | Setup | Level |
Bull | Bounce from support, 4H close above the trendline and resistance with rising volume | $0.00000585, then $0.00000607 and $0.00000627 |
Base | Price stays inside the triangle below the falling trendline. | $0.00000557 - $0.00000585 |
Bear | Rejection at the trendline, then 4H close below support with rising volume | $0.00000557, then $0.00000535 and $0.00000514 |
Shiba Inu vs Bitcoin
$SHIB usually follows the direction of Bitcoin, but with bigger swings. A rally in BTC tends to lift it further, and a pullback tends to hit it harder.
Over the last 24 hours, SHIB slipped 3.4% in dollar terms, 1.9% against Bitcoin, and 1.4% against Ethereum.
Those gaps imply Bitcoin fell by roughly 1.5% and Ethereum by about 2.0%, so SHIB lagged a falling market instead of leading it.
Any bounce toward the trendline will likely need a steady Bitcoin. A deeper BTC pullback would add weight to the bearish case above.
Methodology
This Shiba Inu price forecast relies on three sources. Price levels, trendlines, the Wolfe wave, and RSI come from the Binance SHIBUSDT 4H chart on TradingView.
Market data comes from CoinGecko, and the news item comes from a public X post.
Every level is tied to 4H candles, so a signal counts only after a full candle close. Percentage moves in this Shiba Inu price prediction are measured from the chart price of $0.00000568.
Unverified claims, including the holder growth post, are treated as headlines and not as inputs to any scenario.
Expert Opinion
Market commentary on meme coin charts often makes one point: a triangle resolves with a candle close, not a wick.
Many chart watchers wait for that close, together with volume, before treating a break as real.
On Wolfe waves, analysts commonly note that the pattern is a projection and not a guarantee.
Price can fall short of the target or fail completely if support breaks. For now, SHIB remains below the falling trendline.
Disclaimer: This article is for information only and is not financial advice. Crypto prices are volatile, and the holder growth figure comes from an unverified social post. SHIB can fall below every support level named here, and a failed breakout can reverse quickly. No scenario is guaranteed, and readers should research independently and invest only what they can afford to lose.







.webp)








