Shiba Inu Price Prediction: Solana Access Is Live, Why Is SHIB Down?

Shiba Inu is trading near $0.00000581 after a small daily dip, yet a fresh headline says its token now reaches the Solana network.
Does wider access change the Shiba Inu price prediction October 2026, or is this only a distribution story?
The Shiba Inu coin launched in August 2020 as an Ethereum-based meme token created by a pseudonymous developer known as Ryoshi.
It later added ShibaSwap and Shibarium, a layer-2 network that went live in August 2023.
According to CoinGecko, the Shiba Inu price today is $0.00000581, down 1.7% over the last 24 hours.
The market capitalization is $3.43B, which places SHIB at rank 34. That is roughly 93% below its all-time high of $0.00008845.
Live Shiba Inu (SHIB) Market Data
Metric | Value |
Price | $0.00000581 |
24h Change | -1.7% |
24h Range | $0.00000580 to $0.00000600 |
Market Cap | $3.43B |
Rank | #34 |
Source: market data taken from CoinGecko, as of Oct 6, 2026. Figures may vary slightly across other tracking websites.
Shiba Inu (SHIB) News Today
BSCN reported that the canonical Ethereum version of SHIB is now accessible on Solana through the Sunrise protocol. The integration gives the token direct access to Solana decentralized finance markets.
According to the report, SHIB remains an ERC-20 token and does not leave Ethereum. Sunrise creates a canonical Solana representation of the asset, with the stated aim of reducing liquidity fragmentation.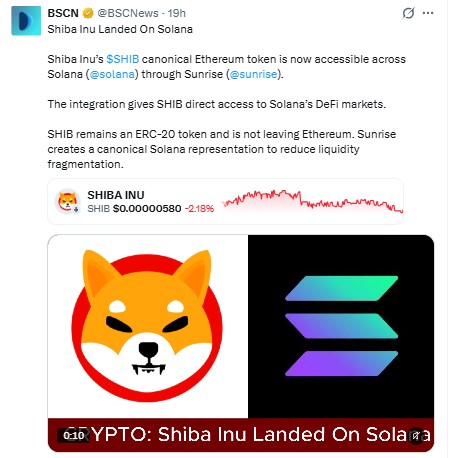
Source: Data Taken From @BSCNews X Account
Wider access can add trading venues and liquidity pools, but it does not guarantee new demand. The same post showed $SHIB at $0.00000580, down 2.18% at that moment, so the news had not produced a visible rally.
Readers should confirm the integration details through official Sunrise and Shiba Inu announcements. Supply-side factors tracked by Shibburn remain a separate part of the $SHIB news picture.
Shiba Inu Price Prediction: 4H Technical Analysis
This Shiba Inu technical analysis uses the Binance SHIB/USDT 4-hour chart captured on October 6, 2026, at 09:35 UTC+5:30.
The latest 4H candle was still open at 0.00000583. Every level below refers to a completed 4H candle close.
Price sits above a rising trendline drawn from the September 20 low. The line has held on pullbacks around September 29 and October 3. 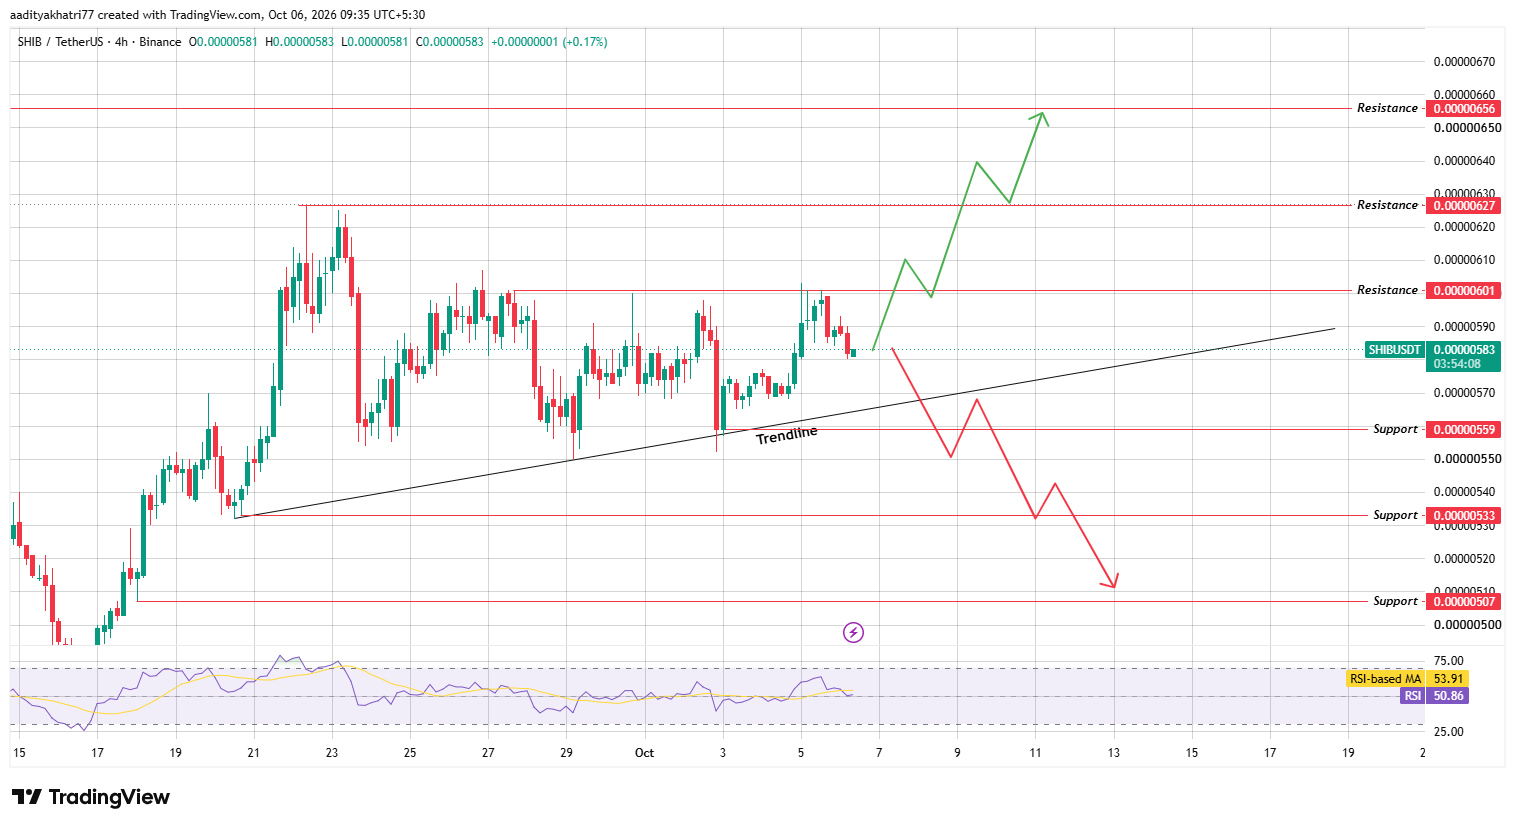
Source: TradingView, SHIB/USDT 4H, Binance, as of October 6, 2026
Above the market, the 0.00000601 resistance capped the price in late September and again on October 5. Behind it sits the September 22 high near 0.00000627.
A rising trendline pressing into flat resistance often ends in a decisive move in one direction. RSI reads 50.86, below its moving average at 53.91.
Momentum is neutral to slightly soft, so buyers need fresh volume to change the picture.
Can $SHIB Bounce and Break $0.00000601?
The bullish case starts with the rising trendline holding. A bounce from that line, backed by volume above the 20-candle 4H average, would show buyers defending the structure. The first test is 0.00000601, about 3.1% above the current price.
A 4H candle close above that level with above-average volume confirms the breakout. A wick through the level without a close does not.
After that, 0.00000627 is the next target, about 7.5% higher. The final marked resistance is 0.00000656, near 12.5% above the current price.
What Happens If $SHIB Breaks the Rising Trendline?
The bearish case begins with a 4H candle close below the rising trendline, which currently sits just under the market price.
That break alone only removes the structure. Confirmation comes from a close under 0.00000559, about 4.1% below the current price, with above-average volume.
From there, 0.00000533 is the next level, near 8.6% lower. The final marked support is 0.00000507, about 13.0% below the current price.
A rejection at 0.00000601 before the trendline break would add weight to this scenario.
Price Levels to Watch
Support | Resistance |
0.00000559 | 0.00000601 |
0.00000533 | 0.00000627 |
0.00000507 | 0.00000656 |
Bull, Base, and Bear Scenarios
For the Shiba Inu price prediction October 2026 window, three outcomes stand out.
Scenario | Setup | Level |
Bull | Bounce from the trendline, then a 4H close above resistance with above-average volume | 0.00000601, then 0.00000627 and 0.00000656 |
Base | The price holds above the trendline and stays below resistance. | Range between 0.00000559 and 0.00000601 |
Bear | 4H close below the trendline, then below support with above-average volume | 0.00000559, then 0.00000533 and 0.00000507 |
Shiba Inu vs Bitcoin
$SHIB fell 1.7% in dollar terms and 0.8% against Bitcoin. That implies Bitcoin itself slipped by roughly 0.9% over the same 24 hours. The Ethereum pair shows a 1.0% decline.
$SHIB usually follows the broad direction of Bitcoin, and the Shiba Inu price prediction depends on that backdrop.
A sharp Bitcoin drop can push SHIB toward 0.00000559 even if its own chart holds. A stable Bitcoin gives the 0.00000601 breakout a better chance of holding.
Methodology
The levels in this article come from the Binance SHIB/USDT 4-hour chart on TradingView, captured on October 6, 2026, at 09:35 UTC+5:30.
Support and resistance reflect horizontal levels where price reacted before. The rising trendline is drawn from the September 20 low.
Market data comes from CoinGecko, and the news item comes from BSCN. Percentage distances use the 0.00000583 price from the chart.
Confirmation rules rely on 4H candle closes and volume against the 20-candle average.
This Shiba Inu price prediction is a scenario map, not a promise of a fixed outcome.
Expert Opinion
General market commentary: Views on SHIB often focus on the gap between ecosystem news and trading activity.
The Solana access report widens where the token can trade, yet traders still wait for the price to confirm interest.
A 4H close above 0.00000601 with strong volume would be the first sign that demand is rising.
A loss of the rising trendline would shift attention to 0.00000559. Any Shiba Inu price prediction 2026 stays conditional on those two events and on the direction of Bitcoin.
Disclaimer: This article is for information only and is not financial advice. SHIB could fall to 0.00000507, about 13% below the current price, or lower if support fails. No bounce or breakout is guaranteed, and a bullish setup can fail within a few candles. Crypto prices are highly volatile, and you can lose part or all of your capital. Research independently before trading.











.webp)





