Shiba Inu Price Prediction: Can SHIB Reclaim $0.000006003?


Will SHIB hold the $0.000004272 support level, or will it slide to a lower support level?
This Shiba Inu price prediction begins with SHIB trading under its broken October range. Buyers tested SHIB breakout resistance earlier, and that rejection set up the slide toward support, the level where buyers have stepped in before. Now the chart squeezes price toward it.
SHIB Price Forecast: 24-Hour Market Snapshot
The latest CoinGecko market data ranks Shiba Inu 37th with a $2.54B market cap. SHIB trades at $0.00000431 after a 9.6% slide over the past week.
Metric | Value |
Price | $0.00000431 |
7-day change | -9.6% |
24h range | $0.000004302 to $0.000004498 |
Market cap | $2.54B |
Market cap rank | 37th |
FDV | $2.541B |
24h volume | $41.762M |
Circulating supply | 589.238T |
Total supply | 589.496T |
Source: CoinGecko, captured Nov 12, 2026, 11:30 UTC
FDV, or fully diluted valuation, is the token's value if every coin in the total supply were already circulating. With 99.96% of total supply in circulation, new supply adds little sell pressure. But a $41.762M daily volume is only 1.6% of market cap, so a push from either side can move the price fast.
SHIB Support Levels: 7-Day Slide Meets $0.000004272
Over 24 hours, $SHIB traded between $0.000004302 and $0.000004498. Price now sits 0.2% above that low. The weekly slide leaves it about $0.00000046 under last week's level.
The $0.000004272 support level sits 0.9% below price. The $0.000004978 resistance level sits 15.5% above it. That's a thin cushion, and a lost support level would hit price fast.
SHIB Whale Wallets: Top 100 Hold 83.14% of Supply
The latest Etherscan holder data shows the top 100 wallets controlling 83.14% of supply. The top 10 hold 62.75%, and the top 5 alone hold 57.91%.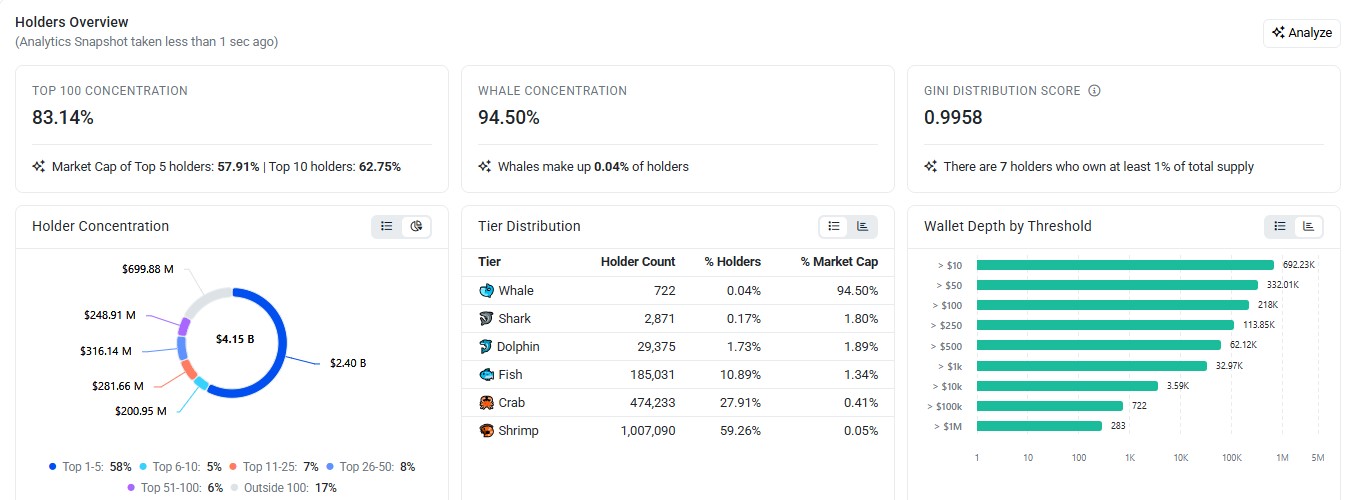
Source: Etherscan, captured Nov 12, 2026, 11:30 UTC
Whales, the wallets above $100K, make up just 0.04% of holders. Yet they own 94.50% of market cap.
The Gini score, a 0-to-1 gauge of how unevenly coins are spread, reads 0.9958. Seven holders own at least 1% of supply each. With ownership this tight, one large transfer to an exchange could add sell pressure fast.
SHIB Open Interest and Futures Volume Data
$SHIB futures volume, the total value of contracts traded, reached $26.24M over 24 hours in CoinGlass futures data. OKX with $6.49M volume. MEXC follows at $5.58M.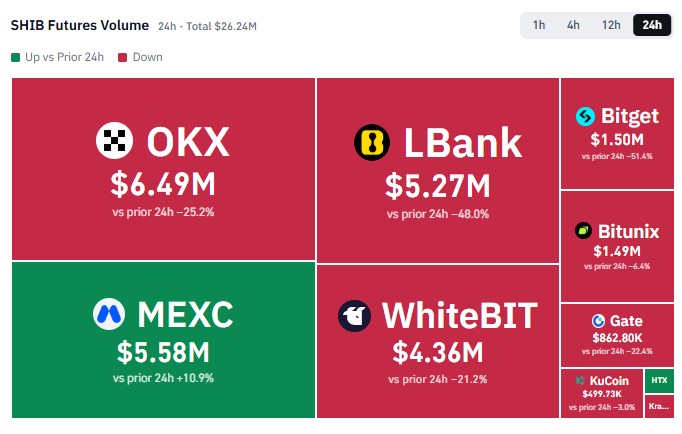
Source: $SHIB futures volume by exchange, captured Nov 12, 2026, 11:30 UTC
MEXC was the only major venue with higher volume, up 10.9%. LBank fell 48.0%, and OKX slipped 25.2%. Shrinking volume on a falling price shows fewer traders pressing the move.
Open interest counts the value of futures contracts still open. CoinGlass shows $31.77M in total $SHIB open interest. Bitget at $8.69M. MEXC sits at $7.79M, a $0.90M.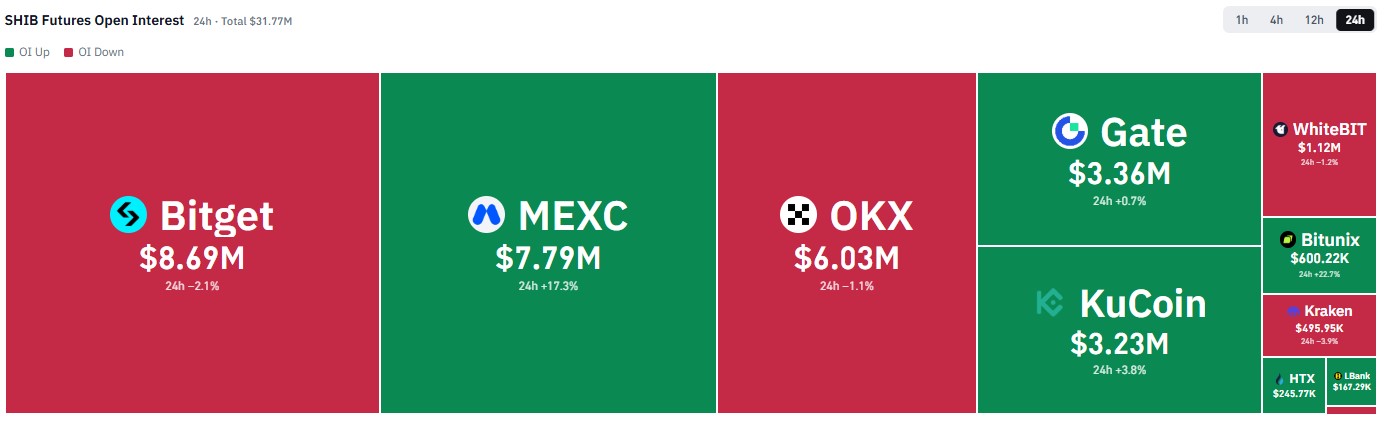
Source: $SHIB futures open interest by exchanges, captured Nov 12, 2026, 11:30 UTC
So why did MEXC add 17.3% in open interest while the price slid 9.6%? Bitunix rose 22.7% and KuCoin 3.8%, which means traders are adding positions into the drop.
That reads bearish. Since Bitget and OKX trimmed 2.1% and 1.1%, the build-up sits on a few venues. Fresh positions add fuel to a break in either direction.
SHIB Technical Analysis: 50-Day EMA and RSI
The OKX 1D chart for $SHIB/USDT on TradingView frames this Shiba Inu price prediction. A September rally pushed SHIB up to the $0.000006003 resistance level before sellers took control.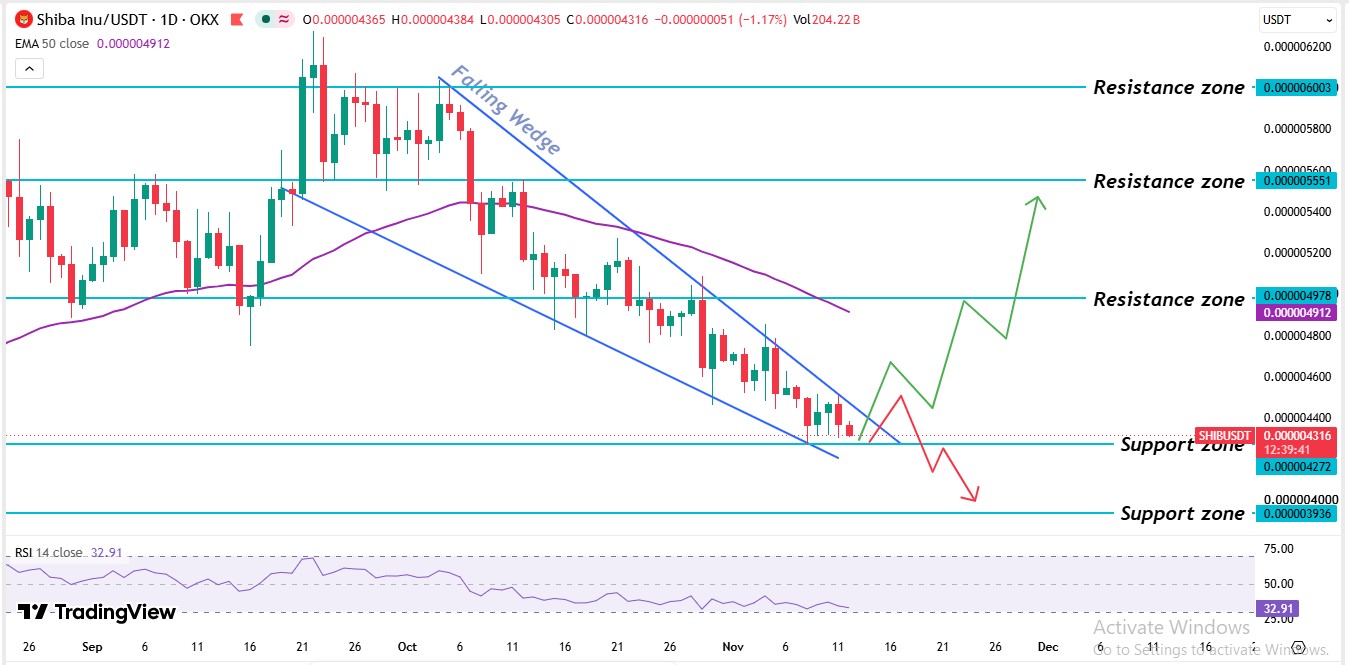
Source: TradingView, $SHIB/USDT 1D chart with EMA 50 and RSI 14, captured Nov 12, 2026, 11:30 UTC
Before the spike, $SHIB traded in a range, a band held between a support level at $0.000004978 and a resistance level at $0.000005551. Buyers tried to break the $0.000006003 level more than once and got rejected each time.
In early October, sellers pushed the price through $0.000005551 and under the 50-day EMA, a moving average that weights recent days more. Readers tracking the earlier SHIB burn channel top analysis can compare that setup with this one. The slide then broke the $0.000004978 EMA level, and lower highs followed.
Right now, SHIB trades 0.9% above the $0.000004272 support level, where buyers need to step in, under both the resistance level and the EMA.
The $SHIB 50-day EMA sits at $0.000004912. $SHIB's $0.00000431 price trades 12.3% below it, and the latest daily candle trades below the level, and the broken $0.000004978 level sits just above it. A real recovery needs a candle trading above both levels.
The $SHIB RSI reads 32.91 on the 14-day setting. It peaked near 70 during the September spike. Under 50 means sellers hold the edge. Above 30 means oversold conditions haven't formed and the price has room to fall.
Shiba Inu Support and Resistance Levels
Level | Type |
$0.000006003 | Resistance level |
$0.000005551 | Resistance level |
$0.000004978 | Resistance level |
$0.000004912 | 50-day EMA |
$0.000004272 | Support level |
$0.000003936 | Support level |
Resistance levels mark where sellers have stepped in, and support levels mark where buyers have. The nearest are $0.000004272 below and $0.000004978 above.
SHIB Price Forecast: Bull, Base, and Bear Scenarios
Scenario | Trigger | Target | Invalidation |
Bull | Daily candle trades above $0.000004978 | $0.000005551 | Daily candle falls back below $0.000004978. |
Base | Price stays between $0.000004272 and $0.000004978. | Sideways trade inside that range | Daily candle breaks either level. |
Bear | Daily candle trades below $0.000004272 | $0.000003936 | Daily candle trades above $0.000004978 |
A sudden regulatory headline can hit any memecoin fast. But the bigger risk is technical, because a daily candle trading below $0.000004272 voids the wedge reversal case.
Expert Outlook: Shiba Inu Price Prediction
According to Coingabbar analysis, this Shiba Inu price prediction leans bearish until a daily candle trades above $0.000004978. An RSI of 32.91 and a price 12.3% under the EMA say sellers hold the edge. And with 94.50% of market cap in whale wallets.
The wedge keeps a bounce possible, but it only counts once the price breaks its upper trendline. Headlines on the latest crypto news page could still shake the range. A daily candle trading below $0.000004272 would confirm the wedge failed and put $0.000003936 in play.
Disclaimer: This article is for information only and isn't financial advice. Traders should do their own research and risk only what they can afford to lose.