Shiba Inu Price Prediction: Will SHIB Break Out Above Key Resistance?

Can SHIB break out? It trades at $0.000004723, just under the top of a descending channel that has held since early October. In this Shiba Inu Price Prediction, the level to watch is $0.00000500, about 6% higher.
A burn tracker also says 44.2M SHIB were burned in 24 hours, while liquidations stayed small at $34.70K.
Market data checked on November 5, 2026, at 13:45 IST.
Shiba Inu Price Prediction Today: Market Overview
Metric | Value |
Price (TradingView OKX 4H chart) | $0.000004723 |
4H Candle Change | +2% |
Candle Open | $0.000004714 |
Candle Range | $0.000004708 – $0.000004724 |
Shiba Inu News Today: 44.2M SHIB Burned
Shibburn on X posted that 44,203,553 SHIB were burned in the past 24 hours. A burn removes tokens from circulation by sending them to a wallet nobody can use.
At today's price, that is about $209. CoinGabbar has not checked the burn on-chain. A burn of this size is small next to the market, so it is a supply detail rather than a clear price driver.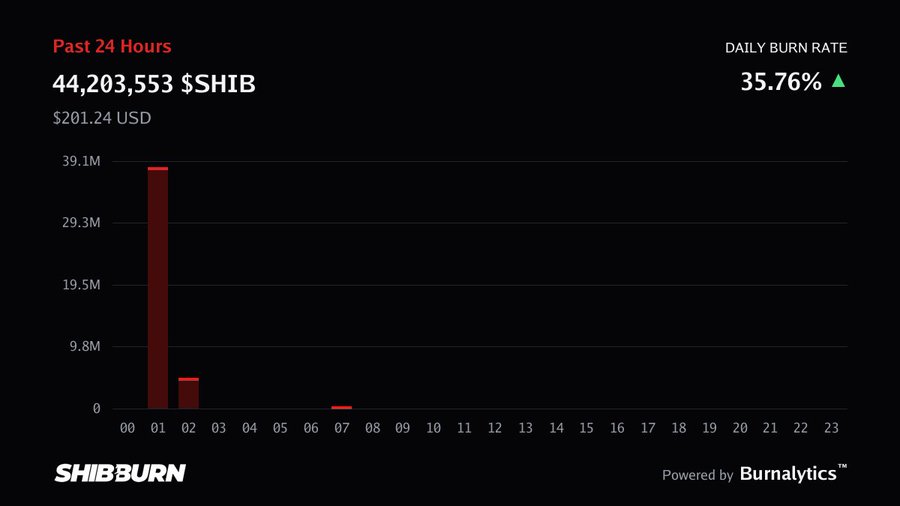
Source: Data From X
SHIB News: SHIB Liquidation Data
A liquidation is a forced close of a leveraged trade when the trader can no longer cover losses. Longs bet on a rise, and shorts bet on a fall.
Window | Total Liquidated | Long | Short |
12h | $4.49K | $582.40 | $3.91K |
24h | $34.70K | $22.79K | $11.91K |
Source: Data From CoinGlass
Longs took about 66% of the $34.70K liquidated over 24 hours. In the last 12 hours, shorts took about 87% of a very small $4.49K. The amounts are tiny.
Shiba Inu Price Prediction: Technical Analysis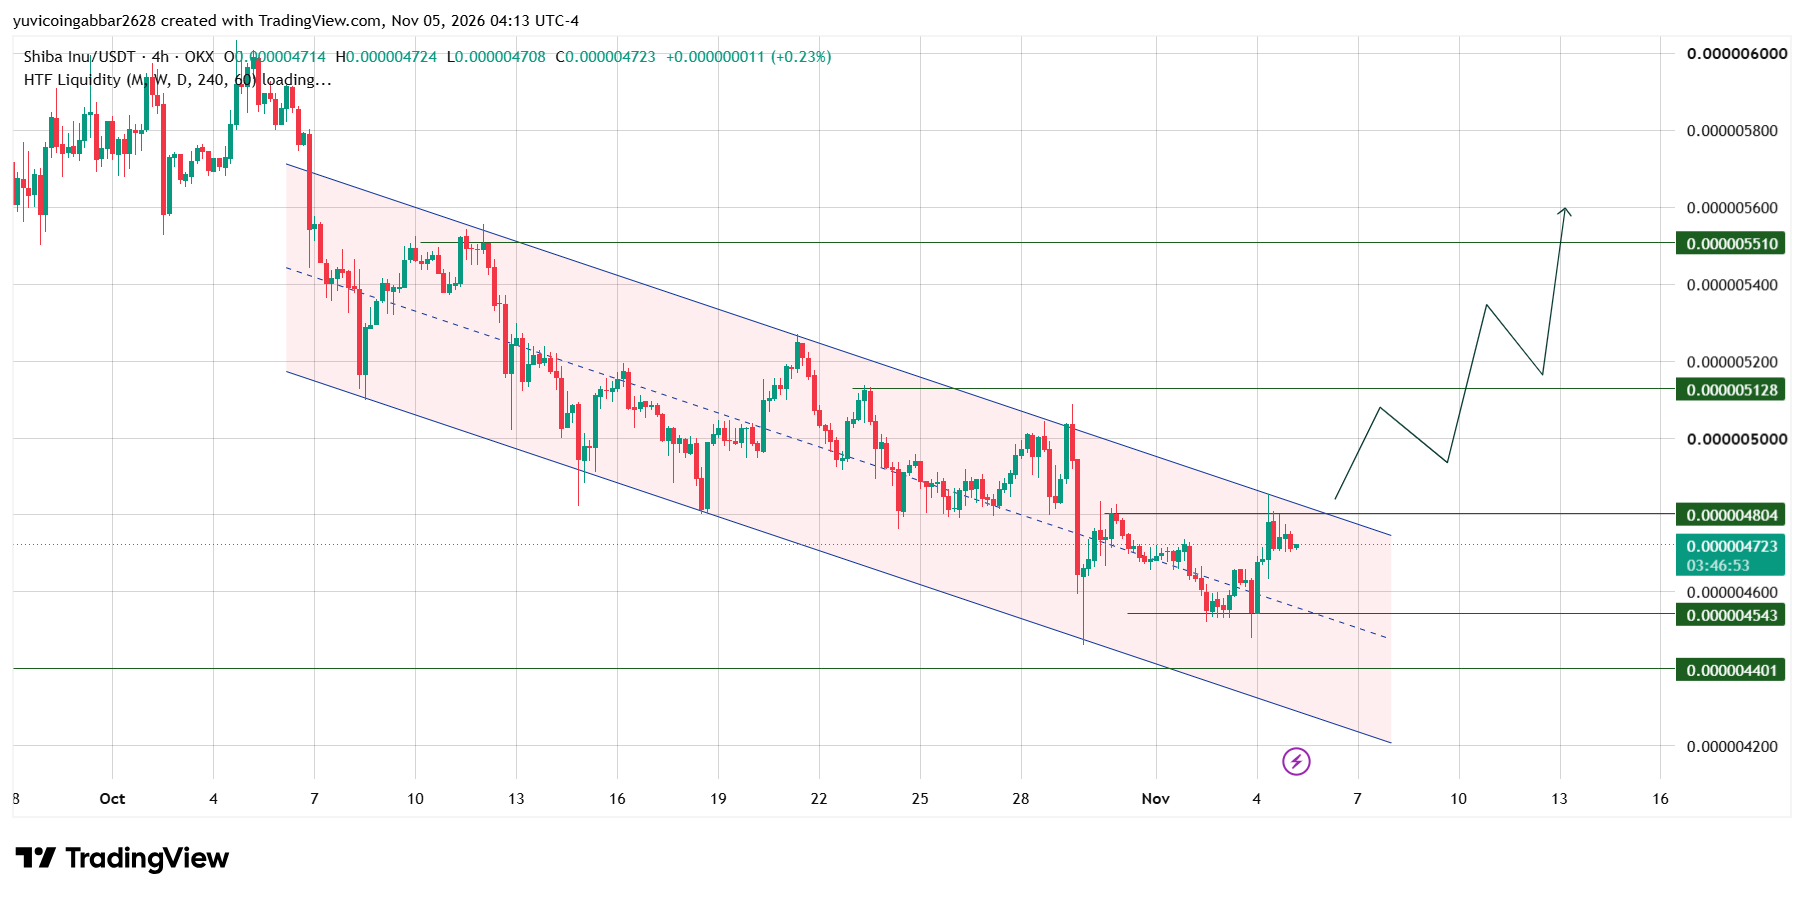
SHIB peaked near $0.0000060 in early October. A descending channel then formed, a pair of downward-sloping boundaries that hold price in a falling range. Inside it, the price keeps making lower highs and lower lows.
SHIB has met the upper boundary at least three times since October, and each time sellers pushed it back. Buyers stepped in near $0.000004543 in early November.
A 4H candle on November 4 poked a little above $0.000004804 near the upper boundary, then fell back. Price now sits at $0.000004723, about 1.7% below it.
What a Confirmed Breakout Needs
A breakout is when price closes outside a pattern's boundary. A first close above the upper boundary, near $0.000004804, would be an early sign.
It is not proof, because price can break out and fall back inside the channel. The round level of $0.00000500 sits above it, and a 4H close above that level would put $SHIB clearly outside the channel.
Holding above it on a later retest, when the price returns to test the broken level, would add confirmation. Without that hold, the move could still be a false breakout.
Shiba Inu Forecast: Support and Resistance Levels
Type | Level |
Resistance 3 | $0.000005510 |
Resistance 2 | $0.000005128 |
Round level | $0.00000500 |
Channel top and Resistance 1 | $0.000004804 |
Immediate support | $0.000004543 |
Deeper support | $0.000004401 |
Bull case: A 4H close above $0.000004804, then above $0.00000500, would open $0.000005128, about 8.6% above today's price.
Bear case: If $SHIB closes below $0.000004543, about 3.8% lower, the price could slide toward $0.000004401, about 6.8% lower.
$SHIB Scenarios and Invalidation (November 5, 2026)
Scenario | Trigger | Likely Outcome | Invalidation |
Bull | Close above $0.000004804 and hold above $0.00000500 | Move toward $0.000005128 | Close back below $0.000004804 |
Base | Range of $0.000004543 to $0.000004804 | Sideways inside the channel | Break of either level |
Bear | Close below $0.000004543 | Slide toward $0.000004401 | Close back above $0.000004543 |
Shiba Inu Price Prediction: Can $SHIB Reach $0.000005510?
It would take a gain of about 17% from $0.000004723. Any SHIB price prediction toward that level needs a confirmed channel breakout first, then a clear move through $0.000005128.
Shiba Inu Price Prediction: Analyst View
$SHIB is pressing the top of its channel but has not broken out. The burn adds little dollar weight, and the liquidations are small.
The level to watch is $0.000004804, then $0.00000500. A close below $0.000004543 would show the channel still in control.
Disclaimer
This article is for informational purposes only and isn't financial advice. Crypto markets are volatile. Always do your own research before making any trading decisions involving SHIB.