SUI Price Prediction: $850M Volume Surge! Altcoin Bull Run Incoming?


Sui just posted $850 million in 24-hour trading volume, up 32.6% from the previous day. Price is trading at $1.0451, up 6% today, testing the lower edge of a descending channel right at its 200-period EMA.
A trader is separately pointing to SUI's MACD curling upward as a sign this could be the start of a broader altcoin bull cycle rather than a bear market.
This Sui Price Prediction looks at both signals against the chart's own channel setup.
Sui News Today: 24-Hour Trading Volume Jumps 32.6% to $850M
A post from the Sui Community account on X reports that SUI hit $850 million in total trading volume over the last 24 hours, up 32.6% compared to the previous day.
Rising volume alongside a price increase can suggest stronger conviction behind a move, though CoinGabbar could not independently verify the exact figure beyond what was shared in the post.
Sui News: Trader Points to a MACD Curl as a Bull Cycle Signal
The post singles out SUI, saying its MACD, the Moving Average Convergence Divergence, a momentum indicator that tracks the relationship between two moving averages, is "beautifully curling upwards" after what the trader calls a regular market correction.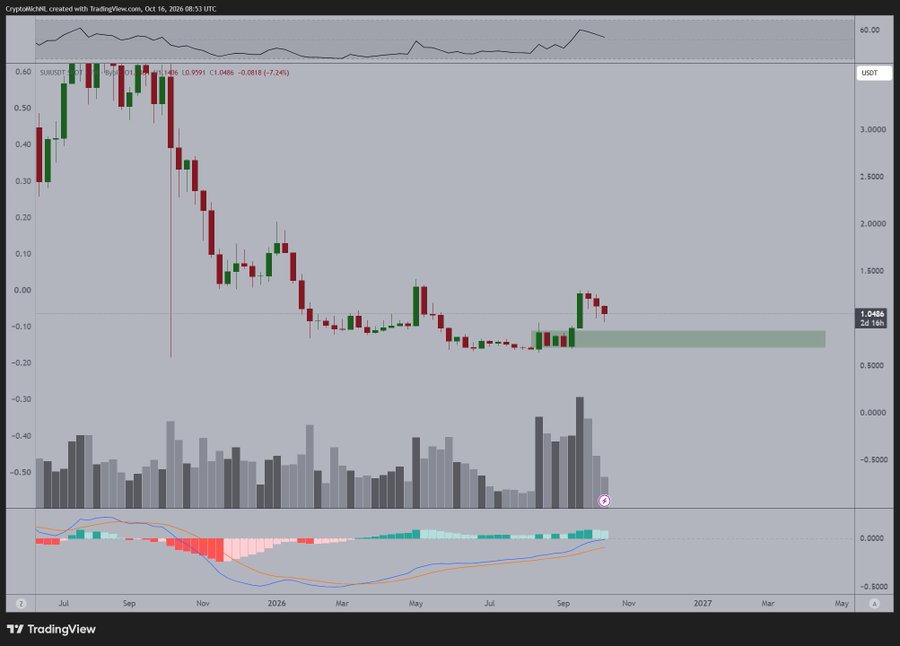
Source: Data From X
This is one trader's technical read, not a confirmed signal, and CoinGabbar could not independently verify the MACD reading shown in the post's chart.
SUI Latest Update: SUI Liquidations Lean Long
Window | Total Liquidated | Long | Short |
12h | $353.89K | $277.05K | $76.84K |
24h | $1.12M | $684.44K | $439.44K |
Source: Data From CoinGlass
Longs took the larger share of liquidations in both windows, roughly 61% of the 24-hour total. That's a bit unusual given today's price gain and may reflect leveraged longs getting shaken out during the channel test before the bounce.
SUI Technical Analysis
SUI is trading at $1.0451, up 6% on a candle that opened at $1.0369 and ranged between $1.0185 and $1.0522.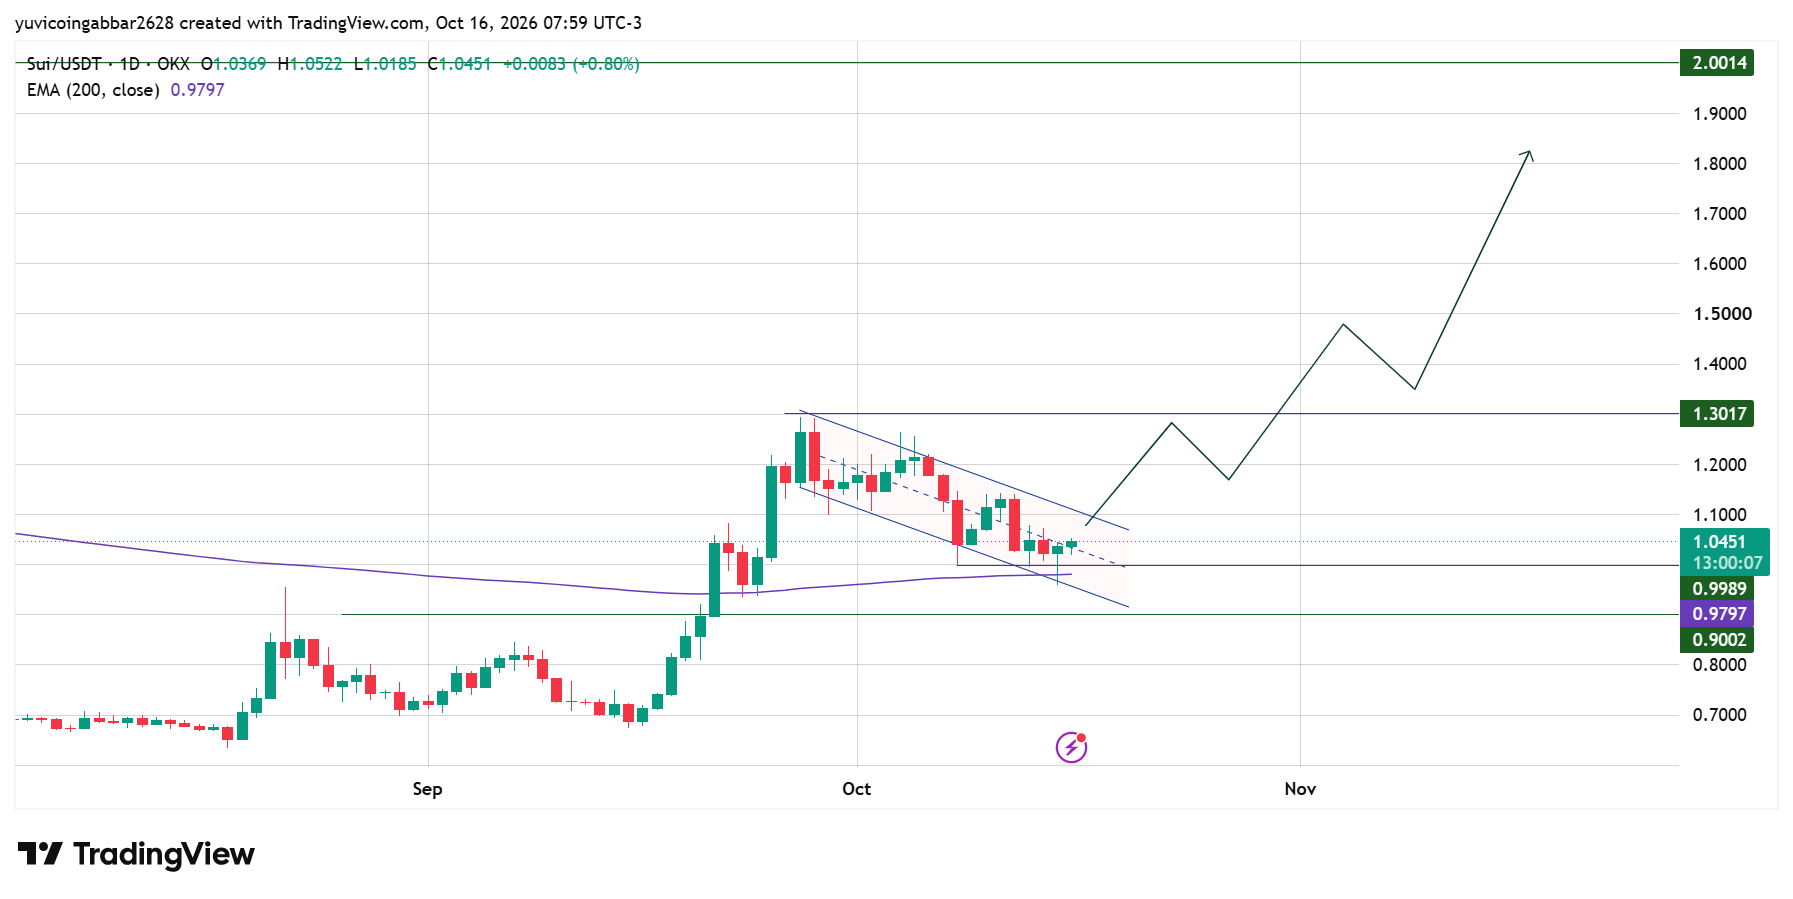
Price has been sliding inside a descending channel since early October and is now testing its lower boundary right at the 200-period EMA, currently at $0.9797.
If SUI breaks above the channel's upper boundary, the chart's projected path shows a climb toward $1.3017, a pullback, then a push toward $2.0014, unfolding over several weeks.
A slide below $0.9797 would suggest the channel is extending, with $0.9002 as the next level down.
SUI Price Scenarios: Bull, Base, and Bear Case
Bull case: A daily close above the channel's upper boundary would support the MACD curl thesis, opening a path toward $1.3017.
Base case: SUI continues testing the $0.9797 to $0.9989 zone while the market weighs today's volume spike against the broader channel.
Bear case: A daily close below $0.9797 would extend the channel, with $0.9002 as the next level.
Support
$0.9797, the 200 EMA, is the key support, with $0.9002 as the deeper level below it.
Resistance
$1.3017 is the first resistance from the channel's projected breakout, followed by $2.0014.
SUI Forecast: Triggers and Invalidation
Scenario | Trigger | Likely Outcome | Invalidation |
Channel breaks up | Close above the channel's upper boundary | Push toward $1.3017 | Close below $0.9797 |
Range holds | Consolidate near 0.9797–1.05 | Base forms | Break below $0.9797 |
Channel breaks down | Close below $0.9797 | Slide toward $0.9002 | Reclaim $0.9797 |
Sui Price Prediction: Is the Bull Cycle Thesis Holding Up?
Possibly, but not confirmed. Today's volume spike and the MACD curl both point in a similar direction, and SUI is testing its channel right at the 200 EMA, a meaningful level either way.
Clearing the channel's upper boundary would be the first real evidence supporting the bull cycle read; losing the EMA would argue against it.
Neither the volume figure nor the MACD claim has been independently verified beyond the posts referenced.
Sui Price Prediction 2026: Expert Analysis
According to CoinGabbar analysts, SUI testing its 200 EMA right as volume picks up is the detail worth watching most.
$0.9797 is the level that matters: holding it keeps the bull cycle thesis alive, while losing it would undercut both the MACD curl argument and today's volume story. This read is based on the daily chart levels above.
Disclaimer
This article is for informational purposes only and isn't financial advice. Crypto markets are volatile. Always do your own research before making any trading decisions involving SUI.
















