SUI Price Prediction: 2 Days Left! Q4 Update & 2026 Key Target Level?


SUI has already rallied over 80% in a single run and only two days remain before Basecamp. SUI price today trades near $1.22 and up 2%; the next big test sits at $1.3384.
A third set of numbers, $1.35 and $3.60, is being passed around as Q4 levels. This SUI price prediction checks those claims against the chart.
The SUI event will take place on October 7–8 at Marina Bay Sands, Singapore, with a focus on the future of finance.
SUI News Today: Kaleo Says SUI Is Ready for the Next Leg Up
SUI looks ready for the next leg up, with only two days left before Basecamp. The post shows a multi-year SUI/USDT chart with a long-term support line marked "HTF Support." HTF means higher timeframe, so the line comes from a chart that covers years, not days.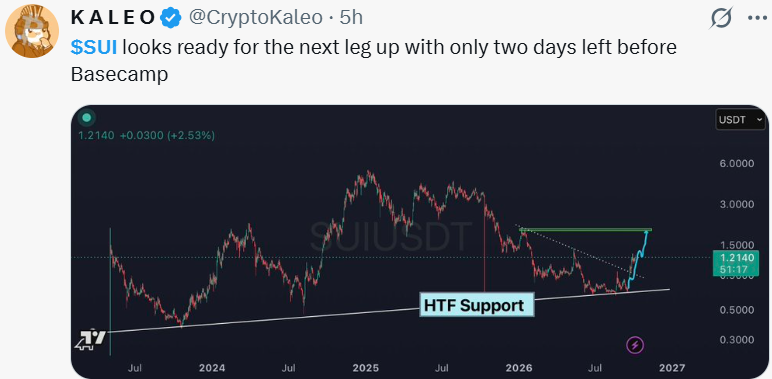
Source: Data From X
The post does not explain what Basecamp is or why it should move the price. CoinGabbar could not independently verify the claim, and it is one trader's view.
SUI News: Sui Community Names Two Q4 Price Levels
Sui Community posted a Q4 update. It says a strong support zone sent SUI up by over 80% in a single rally. For Q4 2026, the post names two price levels: $1.35 and $3.60.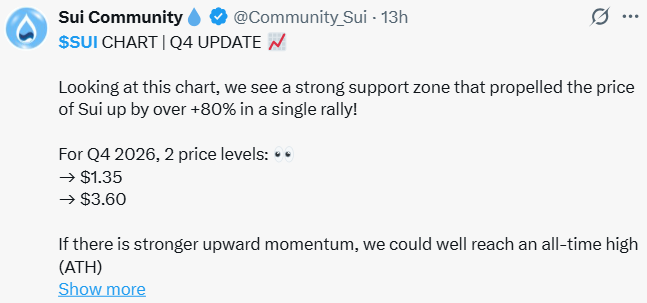
It adds that stronger upward momentum could lead SUI to a new all-time high (ATH) this year, driven by two bullish weekly candles. The ATH is the highest price a coin has ever traded at.
The $1.35 level sits close to the $1.3384 line on the chart below. The $3.60 level falls between the chart's $3.0000 and $4.0000 lines. CoinGabbar could not independently verify these targets.
SUI Technical Analysis
SUI traded below $1.00 through August and early September. In mid-September, the price jumped above the 200 EMA and kept climbing.
It then moved sideways, forming higher lows above the support zone near $1.1004. An EMA (exponential moving average) is the average price over a set number of candles, with more weight on recent ones.
The 200 EMA at $0.9682 is still rising and sits well below price. The latest daily candle ranged from $1.2037 to $1.2507, so buyers pushed the price toward $1.3384 but did not reach it.
SUI Forecast: Support and Resistance Levels
Level Type | Price |
Resistance 4 | $4.0000 |
Resistance 3 | $3.0000 |
Resistance 2 | $2.0020 |
Resistance 1 | $1.3384 |
$1.2187 | |
First Confirmed Support | $1.1004 |
Deeper Support | $0.9529 |
SUI Outlook
Bull case: A daily close above $1.3384 would clear the level that capped the last push. The chart then points toward $2.0020, with $3.0000 as the next level above that.
Bear case: If SUI closes below $1.1004, the support zone fails and the higher lows break. The chart then points toward the 200 EMA at $0.9682, with $0.9529 just below it.
SUI Price Prediction: Can SUI Reach $4?
The $4.0000 level is the highest resistance on the chart, and SUI would need to more than triple from today's price to reach it. The path runs through $1.3384, $2.0020, and $3.0000, and each level has to hold on a daily close.
The $3.60 level from the Sui Community post falls on that same route, between $3.0000 and $4.0000.
SUI Price Prediction 2026: Expert View
According to CoinGabbar analysts, SUI is holding its higher lows, and the $1.3384 line is the one that decides whether this is a breakout or only a pause.
Event-driven posts like the Basecamp countdown can lift attention before the date and fade after it. A daily close above $1.3384 would say more than any post.
Disclaimer
This piece is for informational purposes only and isn't financial advice. The levels and scenarios above are based on technical chart analysis and publicly available data at the time of writing. Crypto markets can move sharply within hours, so past patterns don't guarantee future outcomes. Do your own research and consider your risk tolerance before acting on any level discussed here.








.webp)








