SUI Price Prediction: Bull Run Started! Can $SUI Really 8x From Here?


Two posts say SUI will rise 8x from here, and one names a new all-time high near $14. SUI trades at $1.1583 today, while the highest level on the chart is $3.
This SUI price prediction tests the claims against the levels. It also shows which traders took the losses in the last 24 hours.
SUI Liquidation Data: Longs Took 90% of 24h Losses
Liquidation means a leveraged futures position is closed by force when the trader's margin runs out. Long positions bet on a rise, and short positions bet on a fall.
Futures liquidation data from Coinglass. Spot volume is tracked separately.
Timeframe | Total Liquidated | Long | Short |
1h | $5.60K | $1.84K | $3.76K |
4h | $47.79K | $38.52K | $9.27K |
12h | $519.52K | $164.84K | $354.67K |
24h | $4.39M | $3.95M | $439.07K |
Long traders lost $3.95M of the $4.39M liquidated in 24 hours. Most of that came before the last 12 hours, when the total was only $519.52K. In that recent window, shorts lost more than longs, which fits the small bounce on the chart.
SUI News: Sui Community Account Says SUI Will Reach a New ATH Near $14
An account named Sui Community posted that SUI is set to surge 8x to a new all-time high (ATH) of around $14. The ATH is the highest price a coin has ever traded at. The post says history is set to repeat and shows a monthly chart.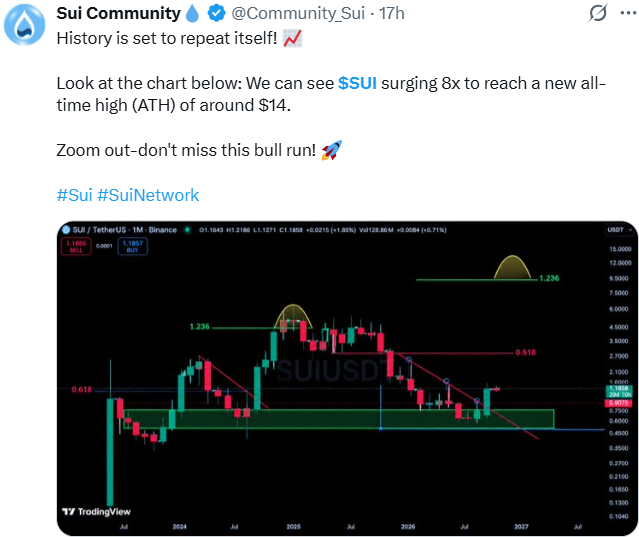
At $1.1583, a move to $14 would be about 12 times today's price, not 8x. CoinGabbar could not independently verify the target or the pattern behind it.
SUI News Today: MikybullCrypto Says SUI Is Likely to Pull 8x
MikybullCrypto posted that SUI is likely to pull 8x from here and told readers not to miss the coming bull run.
The post shows a monthly SUI/USDT chart from OKX. An 8x gain from today's price would put SUI near $9.27.
Source: Data From X
The post gives no reasoning beyond the chart. CoinGabbar could not independently verify this call, and it is one trader's view.
SUI Technical Analysis
SUI fell from a January high near $1.90 and spent June to early September below $1.00. In mid-September, the price jumped above the 200 EMA and kept climbing, stopping before the $1.3384 resistance.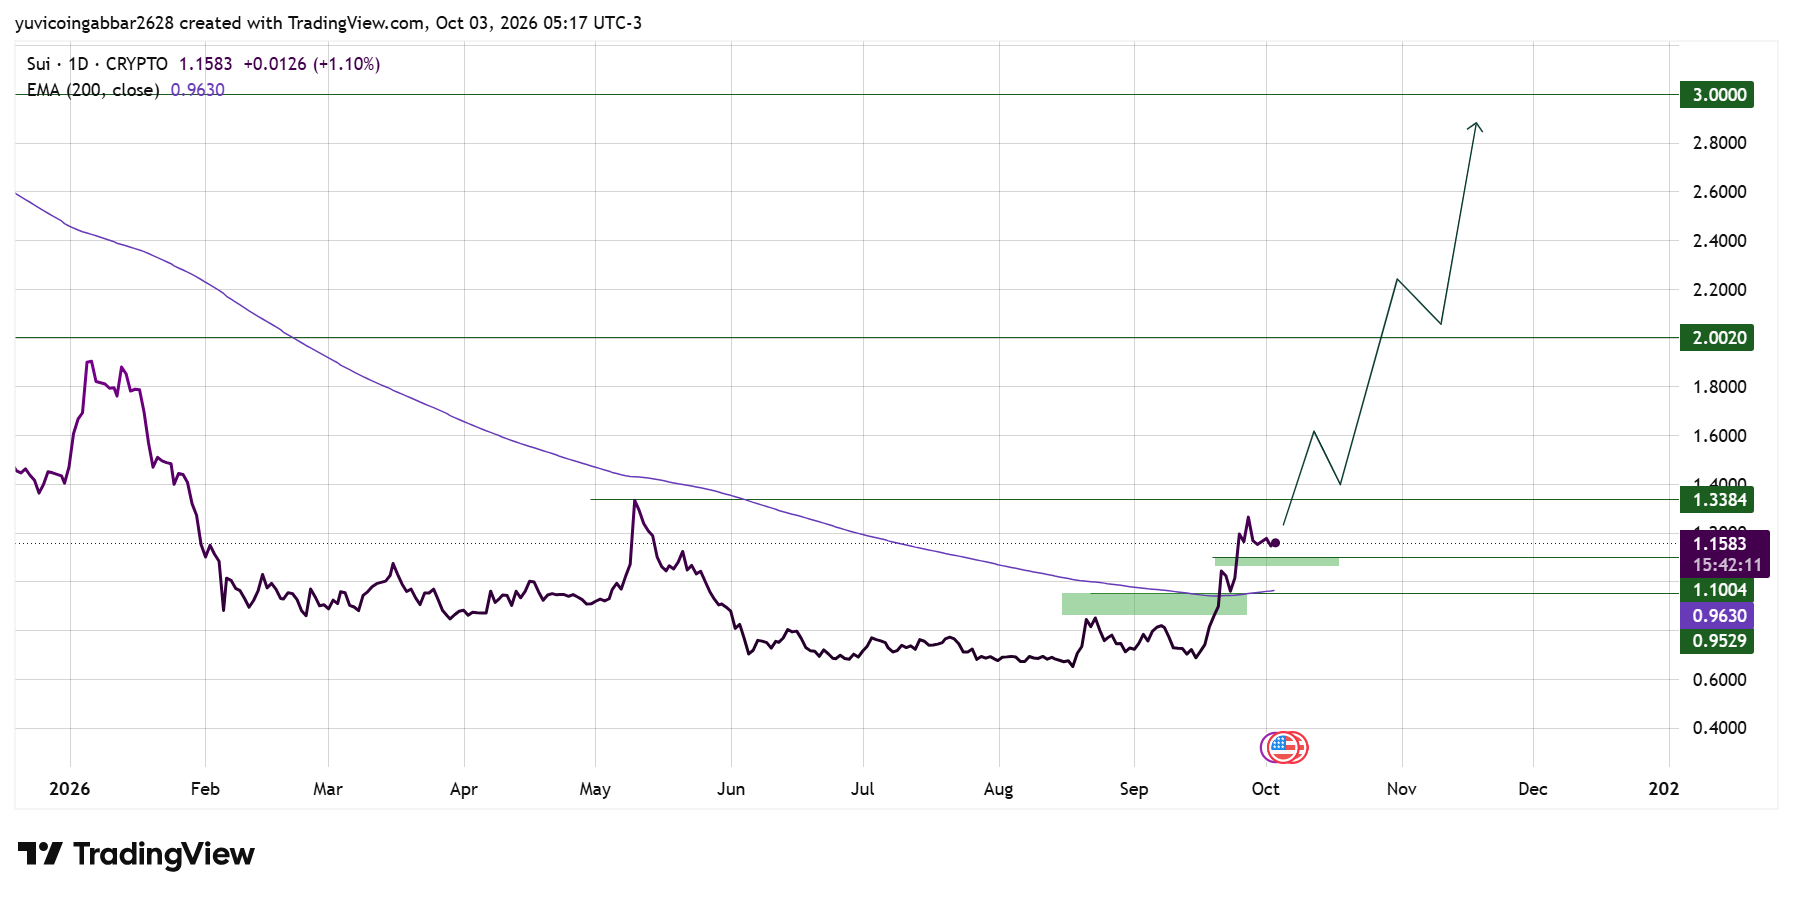
The 200 EMA at $0.9630 had been sloping down all year and is now flattening below price. SUI sits at $1.1583, just above the support zone near $1.1004.
SUI Forecast: Support and Resistance Levels
Level Type | Price |
Resistance 3 | $3.0000 |
Resistance 2 | $2.0020 |
Resistance 1 | $1.3384 |
$1.1583 | |
First Confirmed Support | $1.1004 |
EMA 200 Support | $0.9630 |
Deeper Support | $0.9529 |
The SUI Outlook
Bull case: A daily close above $1.3384 would clear the May high and point toward $2.0020. That would be the first sign that the recovery is turning into a breakout.
Bear case: If SUI closes below $1.1004, the support zone fails and the chart points toward the 200 EMA at $0.9630. The zone at $0.9529 sits just below it.
SUI Price Prediction: Can SUI Reach $3?
The $3.0000 level is the highest level on the chart. SUI would first need to close above $1.3384, then clear $2.0020.
The 8x calls would need $9.27 or more, which is well beyond any level on this chart.
SUI Price Prediction 2026: Expert View
According to CoinGabbar analysts, SUI is in a recovery above the 200 EMA, not yet in a breakout. The two 8x posts add noise, not evidence, since neither shows a reason tied to the daily chart.
The $1.3384 high from May is the first real test, and a loss of $1.1004 would weaken the whole setup.
Disclaimer
This piece is for informational purposes only and isn't financial advice. The levels and scenarios above are based on technical chart analysis and publicly available data at the time of writing. Crypto markets can move sharply within hours, so past patterns don't guarantee future outcomes. Do your own research and consider your risk tolerance before acting on any level discussed here.







.webp)








