Crude Oil Price Prediction: Can WTI Break $94 After Tanker Strike?


The crude oil price prediction for early October depends on one question: can WTI bounce and break the upper boundary of its descending channel with volume?
Price closed down 1.78% at the latest session, but it is sitting near the top of the channel, so the next move could be decisive.
WTI (West Texas Intermediate) is the main US crude oil benchmark and is priced in US dollars per barrel.
Traders often follow it through CFDs, and its price reacts quickly to supply news and geopolitical headlines.
For the latest crude oil price today, WTI trades at $91.25 per barrel, down $1.65, or 1.78%, at the latest close.
The 4-hour chart shows the market recovering from a sharp slide that began from above $100 in mid-September.
Crude Oil (WTI) Live Data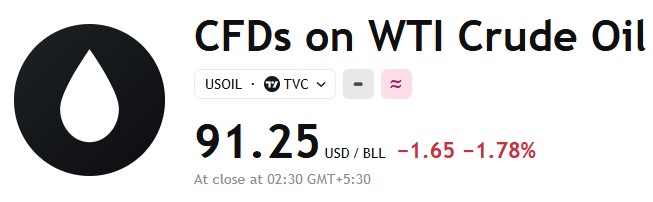
Source: market data taken from TradingView (TVC), latest close at 02:30 IST, Oct 3, 2026. Figures may vary slightly across other platforms.
Crude Oil (WTI) News Today
Two headlines are shaping the oil market today. The first says OPEC+ has delayed the review that sets its 2027 oil quotas.
The capacity check was due at the end of September and has slipped to mid-November, because war-damaged projects make it hard to say how much some members can really pump. 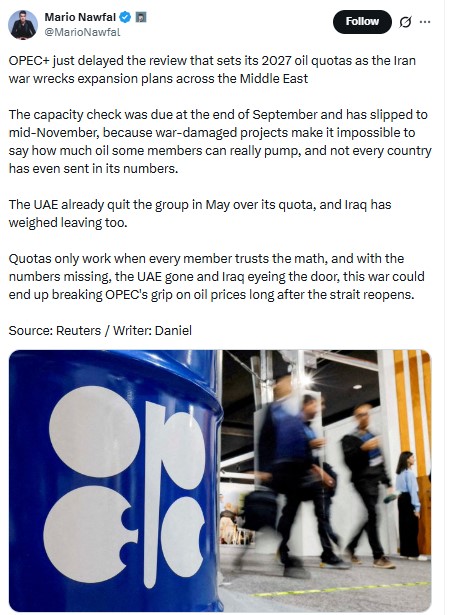
Source: Data taken from @MarioNawfal, X Accounts, as of Oct 3, 2026
The post adds that the UAE quit the group in May over its quota and that Iraq has weighed leaving too.
The second is a breaking report that Iran struck an oil tanker off the coast of Oman while it was passing through the Strait of Hormuz.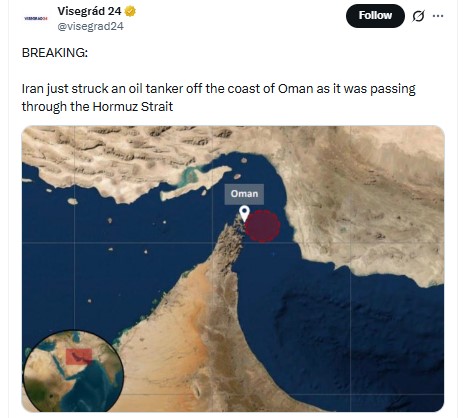
Source: Data taken from @visegrad24, X Accounts, as of Oct 3, 2026
Both items come from social media posts, and the first cites Reuters as its source.
They are treated here as unverified headlines until confirmed by official or major news sources.
Crude Oil (WTI) Technical Analysis
This crude oil technical analysis uses the 4-hour (4H) WTI chart, captured at 14:06 IST on October 3, 2026. Because it is a weekend, the price shown is the latest close, not a live quote.
Price is moving inside a descending channel that began near September 24.
The upper boundary slopes down from the early highs, the lower boundary slopes down from the first low, and the dashed midline runs between them.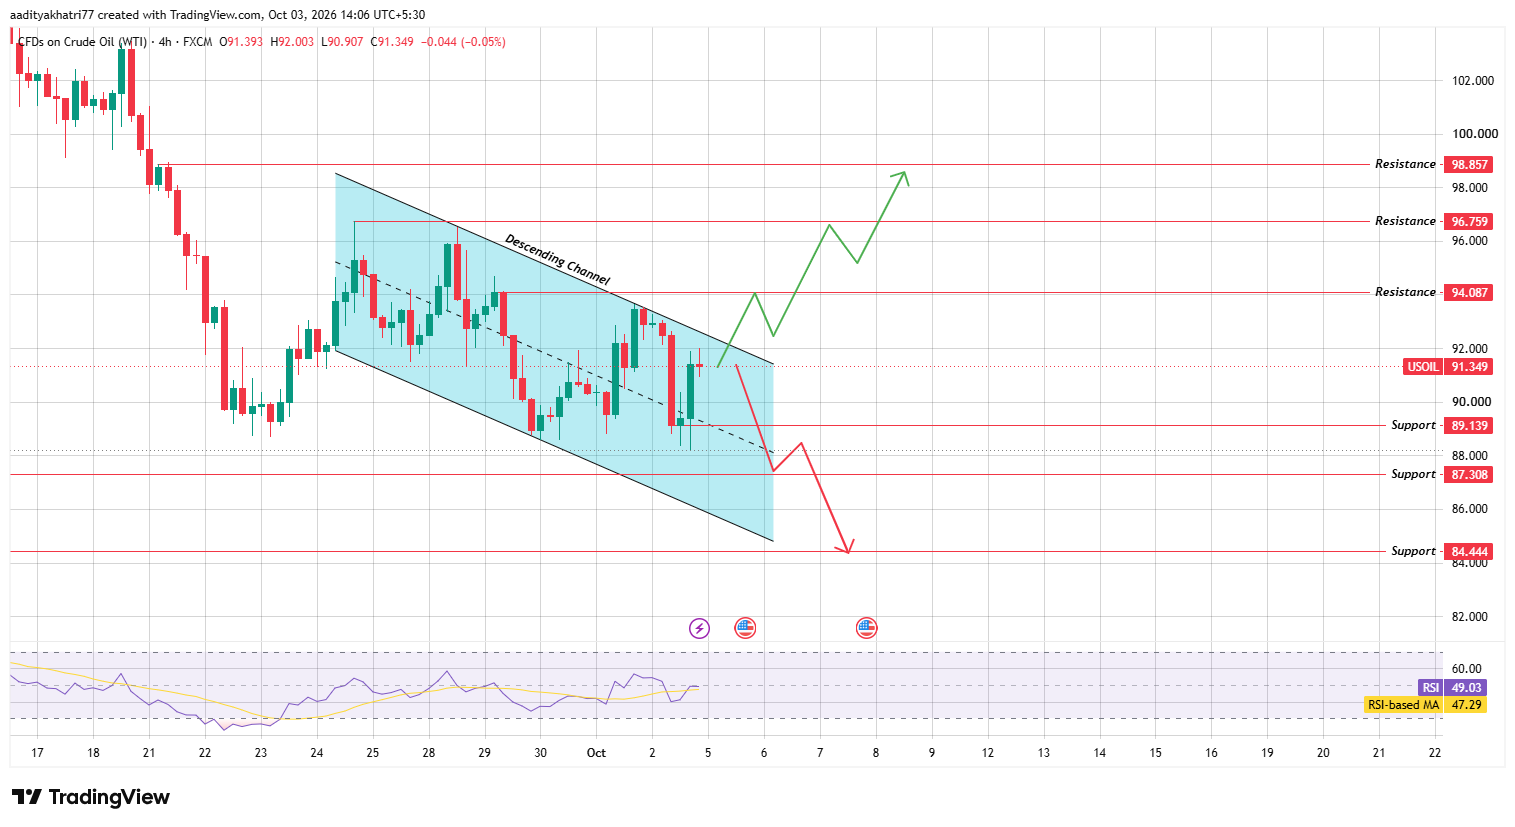
Source: Chart taken from TradingView, WTI Crude Oil CFD (FXCM), 4H, October 3, 2026
After a sharp fall from above $100, WTI found a low near $88 and bounced. It now trades near $91.35 on the chart, close to the upper boundary of the channel. This is the area where sellers have stepped in on earlier attempts.
The RSI reads 49.03 and sits above its moving average at 47.29. That shows neutral momentum with a slight improvement, but not yet a strong buy signal.
Can Crude Oil Push Toward Higher Resistance?
The bullish case starts with a bounce and a break of the upper boundary of the channel. If buyers push the price through it, the first target is $94.087, about 3.0% above the chart price.
A real breakout needs more than a brief touch. A 4H candle should close above the upper boundary, and volume should be at least 1.5 times the average of the previous 20 candles.
Once that happens, the next stops are $96.759, roughly 5.9% higher, and then $98.857, a gain near 8.2%. A move outside the channel on weak volume would leave the price open to a fade, so the signal is not confirmed until volume agrees.
What Happens If Crude Oil Gets Rejected?
The weaker path begins with a rejection at the upper boundary. If the price turns down, it would slide back toward the $89.139 support, about 2.4% below the chart price.
A break below that level, confirmed by a 4H close and the same 1.5x volume threshold, would open the way to $87.308, around 4.4% lower. The final support on the chart is $84.444, about 7.6% below the current level.
The lower half of the channel has held so far, so a clean break under support would also be a sign that the descending trend is getting stronger.
Price Levels to Watch
Support | Resistance |
$89.139 | $94.087 |
$87.308 | $96.759 |
$84.444 | $98.857 |
Bull, Base, and Bear Scenarios
Scenario | Setup | Level |
Bull | Bounce, then 4H close above the channel's upper boundary with rising volume | $94.087, then $96.759 and $98.857 |
Base | Price stays inside the descending channel. | $89.139 - $94.087 |
Bear | Rejection at the upper boundary, then 4H close below support with rising volume | $89.139, then $87.308 and $84.444 |
How Could These Headlines Affect Oil Prices?
The two headlines push oil in different directions. A tanker strike near the Strait of Hormuz raises supply risk, because a large share of the world's seaborne oil passes through that route.
If the report is confirmed and attacks continue, traders may add a risk premium, and shipping and insurance costs could rise, which would support a break above the channel. On the other hand, the OPEC+ delay adds uncertainty about future supply.
With the UAE gone and Iraq weighing an exit, weaker group discipline could mean more barrels later, which can pressure prices over time.
These opposite forces may explain why WTI is still stuck in a channel, and the latest close was down 1.78%, so the headlines have not yet produced a clear breakout.
Traders should watch for official confirmation and for how volume reacts when the market reopens.
Methodology
This crude oil price forecast relies on two sources. Price levels, the descending channel, and RSI come from the WTI 4H chart on TradingView, and the price data comes from the TradingView (TVC) quote.
The news items come from public X posts. Every level is tied to 4H candles, so a signal counts only after a full candle close.
Percentage moves in this crude oil price prediction are measured from the chart price of $91.349. Unverified claims, including both news posts, are treated as headlines and not as inputs to any scenario.
Expert Opinion
Market commentary on oil charts often makes one point: a channel breakout counts when a candle closes outside the boundary with strong volume, not when a wick pokes through it. Many chart watchers wait for that close before treating the move as real.
On geopolitical headlines, analysts commonly note that oil spikes can fade fast if supply is not actually disrupted.
Price action and volume usually matter more than the headline itself. For now, WTI remains inside the descending channel.
Disclaimer: This article is for information only and is not financial advice. Oil prices are volatile and can move sharply on geopolitical news, and both news items are unverified social posts. WTI can fall below every support level named here, and a failed breakout can reverse quickly. No scenario is guaranteed, and readers should research independently and trade only with money they can afford to lose.







.webp)








