Uniswap Price Prediction: UNI’s Next Big Move Depends on This Retest?

UNI just got slapped down hard, rejected sharply from the $10 to $11 zone and dragged back near $7.62 on the weekly chart, a move that liquidated a wall of leveraged longs along the way.
Traders are now watching this retest closely, because how UNI behaves here decides the next big move.
This Uniswap price prediction breaks down the chart, the liquidation data, and the key levels bulls and bears are both watching.
Uniswap is a decentralized exchange protocol for trading crypto tokens, according to the project's own materials. Stick around till the end.
UNI Price Today: Market Snapshot
Metric | Value |
Price | $7.3716 |
Daily Change | -5% |
Weekly Change | -16.07% |
EMA 200 | $5.2301 |
Why Is UNI's Price Down Today?
UNI is down 5% in 24 hours to $7.3716, underperforming a broader market that's only slightly negative.
The drop looks tied mainly to a sector-wide altcoin sell-off rather than anything specific to Uniswap, as capital rotated out of riskier assets.
Adding to the pressure, Bitcoin's own pullback, driven by sizable ETF outflows and hawkish Federal Reserve minutes, appears to be spilling over into altcoins broadly, UNI included.
If UNI holds above the $7.00 support, it may settle into consolidation; a break below that level risks a move toward $6.68.
Markets will likely stay cautious until there's broader stabilization, with the October 14 US inflation data standing out as the next key trigger.
UNI Liquidation Data: A Long Squeeze in Progress
The liquidation numbers tell a clear story. Over the last 24 hours, $10.67M was wiped out, and $10.42M of that was longs, with shorts barely touched at $247.99K.
The same lean shows up in the 12-hour window too, with $192.64K in long liquidations against $71.85K in shorts.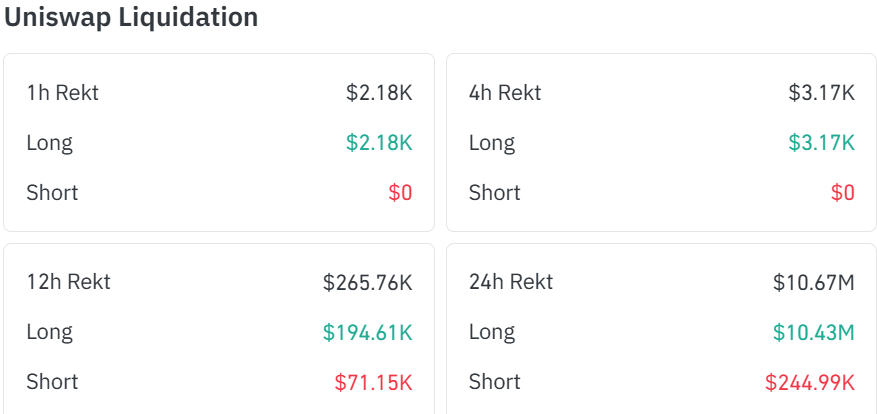
Source: Data From CoinGlass
This points to a sharp drop that caught leveraged long traders off guard, which lines up with the rejection from $10-11 described on the weekly chart.
$UNI Price Chart: Technical Analysis
UNI is trading at $7.3716, down -5%, and broke the trendline, bouncing after the sharp weekly rejection from the $10-11 zone. The 200 EMA at $5.2301 sits well below the current price, still sloping upward from the August rally, showing the broader trend hasn't broken despite this pullback.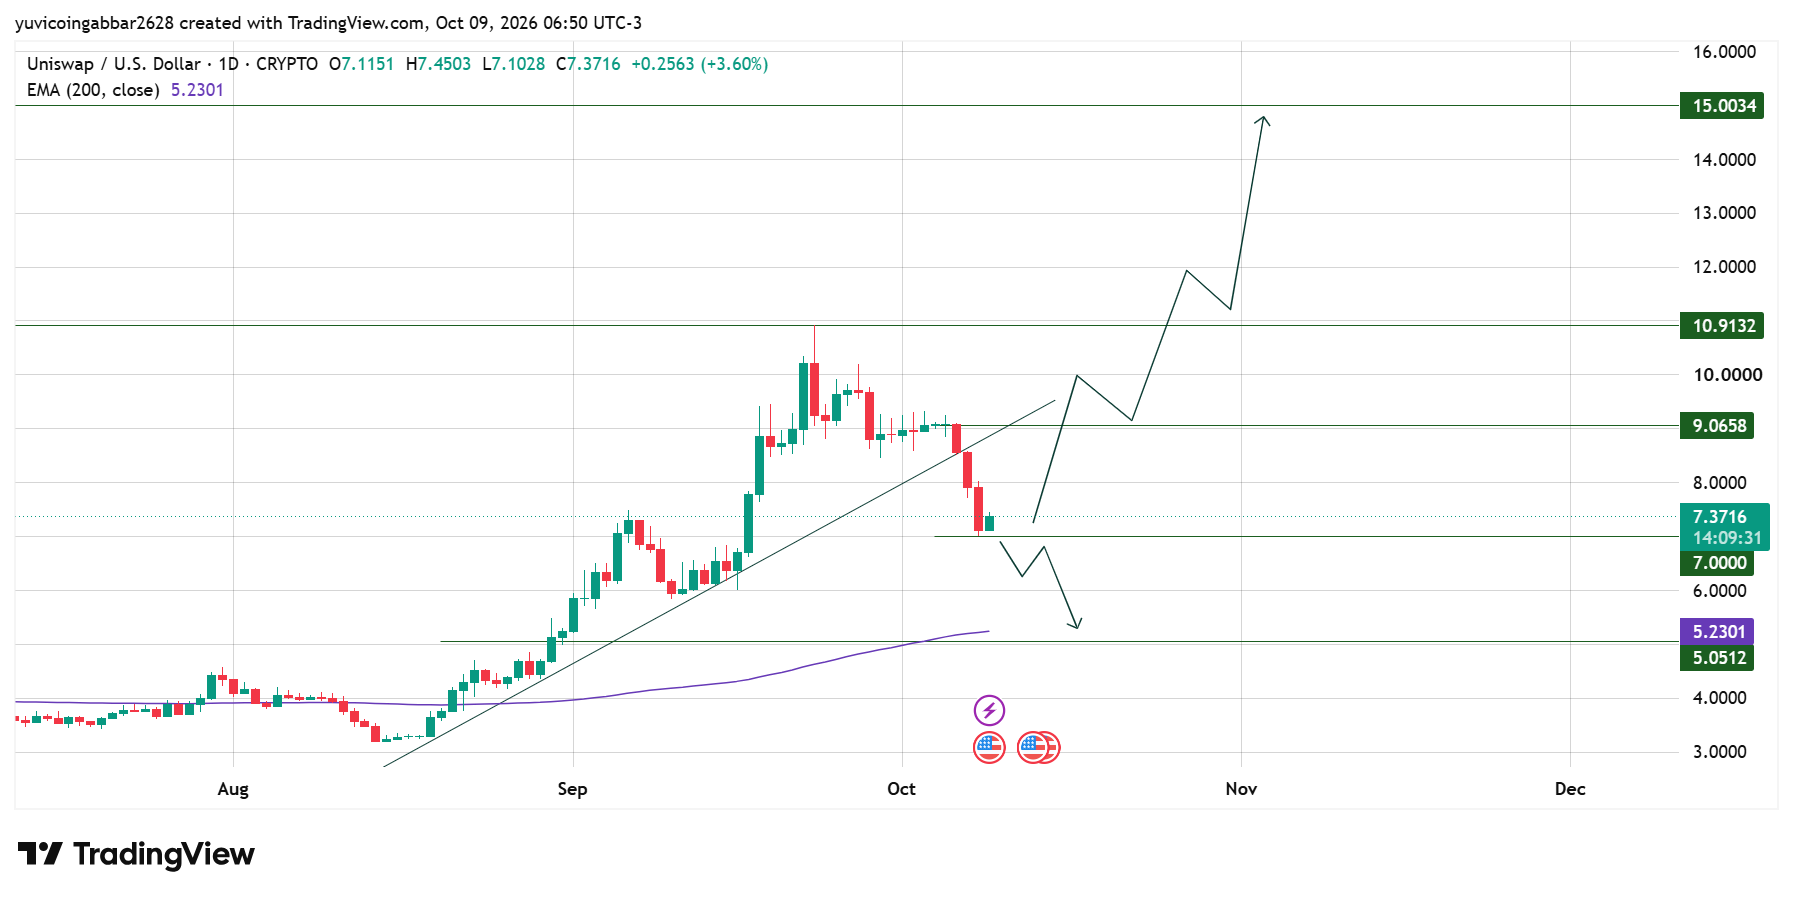
A separate weekly analysis flagged the $6 to $7 area as the first support zone to watch, with a hold there keeping a higher-low structure possible.
UNI Outlook: Key Support and Resistance Levels
Level Type | Price |
Resistance 3 | $15.0034 |
Resistance 2 | $10.9132 |
Resistance 1 (nearest) | $9.0658 |
Immediate Price Reference | $7.3716 |
Support 1 | $7.0000 |
Support 2 (EMA zone) | $5.2301 |
Support 3 | $5.0512 |
Uniswap Forecast
Bull case: Holding the $6 to $7 support zone keeps a higher-low setup alive. A confirmed weekly close above the $10-11 resistance could open the path toward $14-16, with the $18-20 zone as the bigger target beyond that.
Bear case: A weekly close below $6 would put the recovery attempt in doubt and bring the deeper $4-5 range back into focus, undoing the higher-low structure.
Uniswap Price Prediction: Can $UNI Reach $20?
The $18-20 zone is the major supply area flagged on the weekly analysis, and $15.0034 is the highest resistance marked on the daily chart.
Getting there would require UNI to first reclaim $9.0658, then clear the $10-11 breakout barrier, before the path toward $14-16 and eventually $18-20 opens up, a move of roughly 149% from current levels if it plays out in full.
Uniswap Price Prediction 2026: Expert View
According to CoinGabbar analysts, the long liquidation wave suggests this drop flushed out leveraged positioning rather than reflecting a change in the bigger trend, since price remains well above the rising 200 EMA.
The $6 to $7 zone is the battleground now: holding it keeps the setup constructive, while losing $6 on a weekly close shifts the picture bearish.
Disclaimer
This isn't financial advice, just a read of the chart and data as they stand today. Crypto markets move fast and leveraged positions can get liquidated quickly, so treat these levels as things to watch rather than guarantees, and size any position around your own risk tolerance.

















