Rektober 2026: Is Crypto Market Heading for Another October Crash?


Is Rektober Back as $1B Gets Liquidated?
Rektober fears are back after a rough Thursday. Bitcoin fell to $80,393, and traders lost over $1 billion to forced liquidations in 24 hours.
The timing is hard to ignore. October 10 marks one year since a crash wiped out about $19 billion in trades.
Bitcoin peaked near $126,200 that week and has not returned.
What Is Rektober and Is It Happening Again?
"Rektober" is the crypto nickname for ugly October sell-offs. This week gave traders a small reminder.
CoinGlass counted 178,815 liquidated traders and $1.08 billion in total losses. Longs lost $916.96 million. Shorts lost $161.43 million.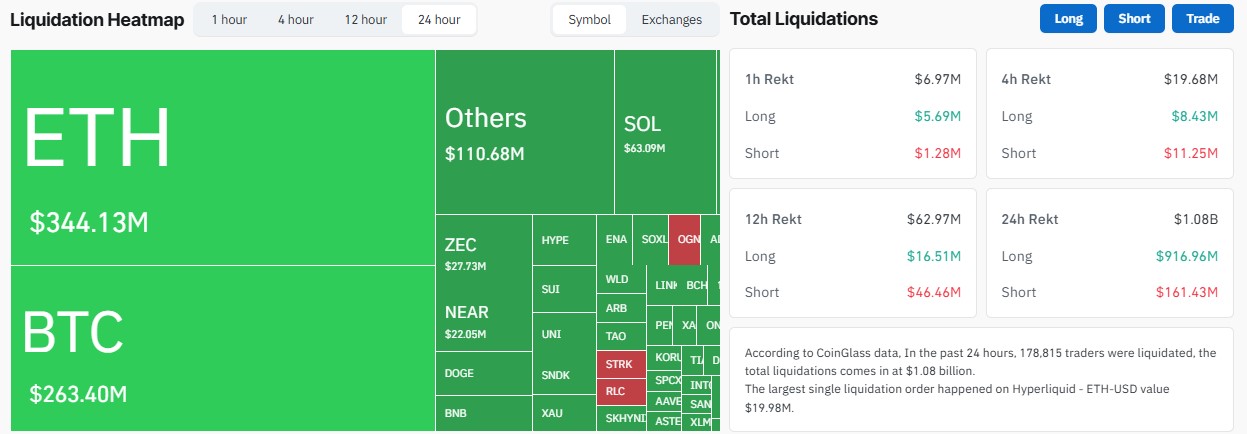
The largest single order was $19.98 million in ETH-USD on Hyperliquid.
Most of the pain came early. The last 12 hours saw $62.97 million in liquidations, the last 4 hours $19.68 million, and the last hour $6.97 million.
| Asset | 24H Liquidations |
| ETH | $344.13M |
| BTC | $263.40M |
| SOL | $63.09M |
| ZEC | $27.73M |
| NEAR | $22.05M |
Why Is Bitcoin Falling Today?
Leverage played a big role. Too many traders bet on higher prices, and a dip forced them out.
Rates add pressure. CME FedWatch shows an 80.6% chance the Fed holds at 3.75% to 4.00% on October 28. A hike has a 19.4% chance. A cut has 0%.
A month ago, a cut to 3.50% to 3.75% had a 27.6% chance. That hope is gone.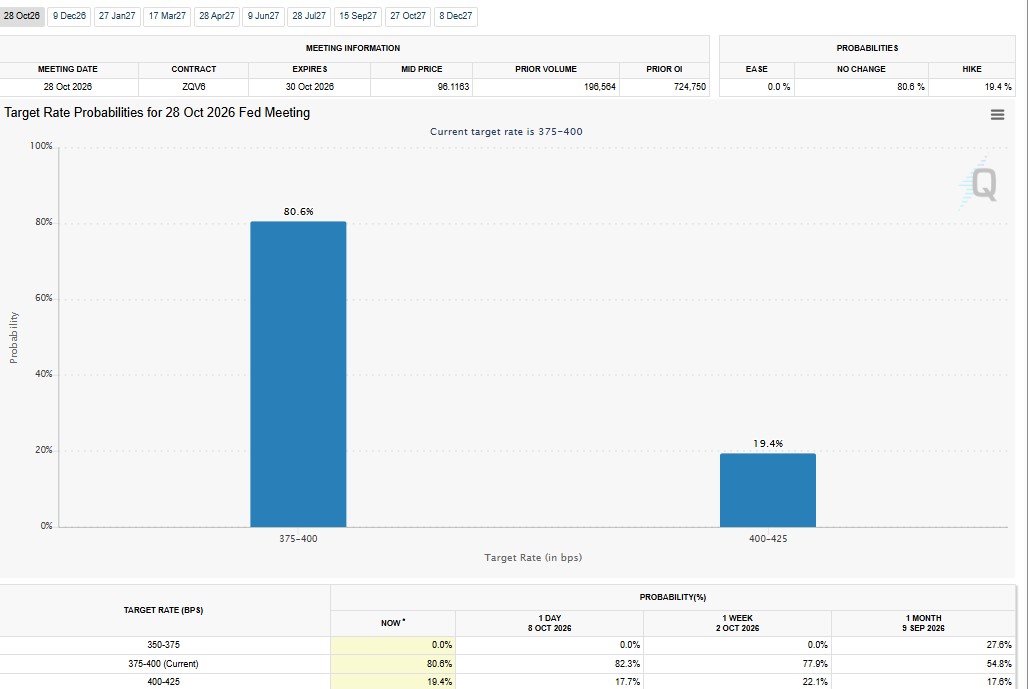
Bond yields are high too. The 10-year sits near 5.27%. The 30-year hit 5.70%, its highest since 2002.
Profit-taking joined in. Holders locked in about $1.03 billion in gains, the second-biggest day of 2026. The year's peak is $1.04 billion.
Sentiment is cooling. The Fear and Greed Index reads 59, down from 64 yesterday and 72 last week. Last month it was 66.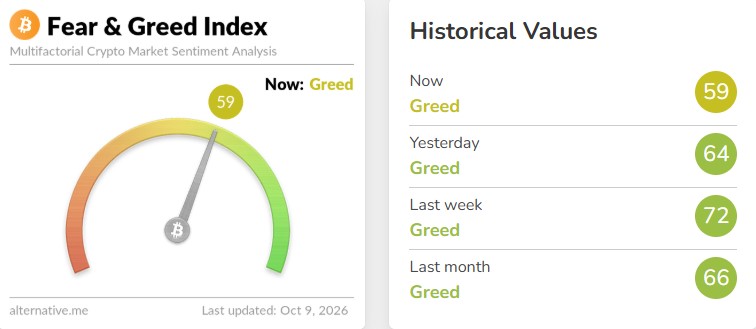
Will Bitcoin Hold $78,000? BTC Price Outlook
BTC trades at $82,420 on the weekly chart, down 4.73%. It bounced from the $60,000 area and still sits above all four key weekly averages.
The 20-, 50-, 100-, and 200-week EMAs are $75,592, $78,298, $78,847, and $69,358. RSI is 57.79, which is firm but not overheated.
Resistance sits at $85,000 to $90,000. A clean break above $87,000 to $90,000 could open $95,000 and $100,000. A stronger rally might test $110,000.
If $78,000 to $75,000 fails, $70,000 comes into play. Below that, traders watch $65,000 to $60,000.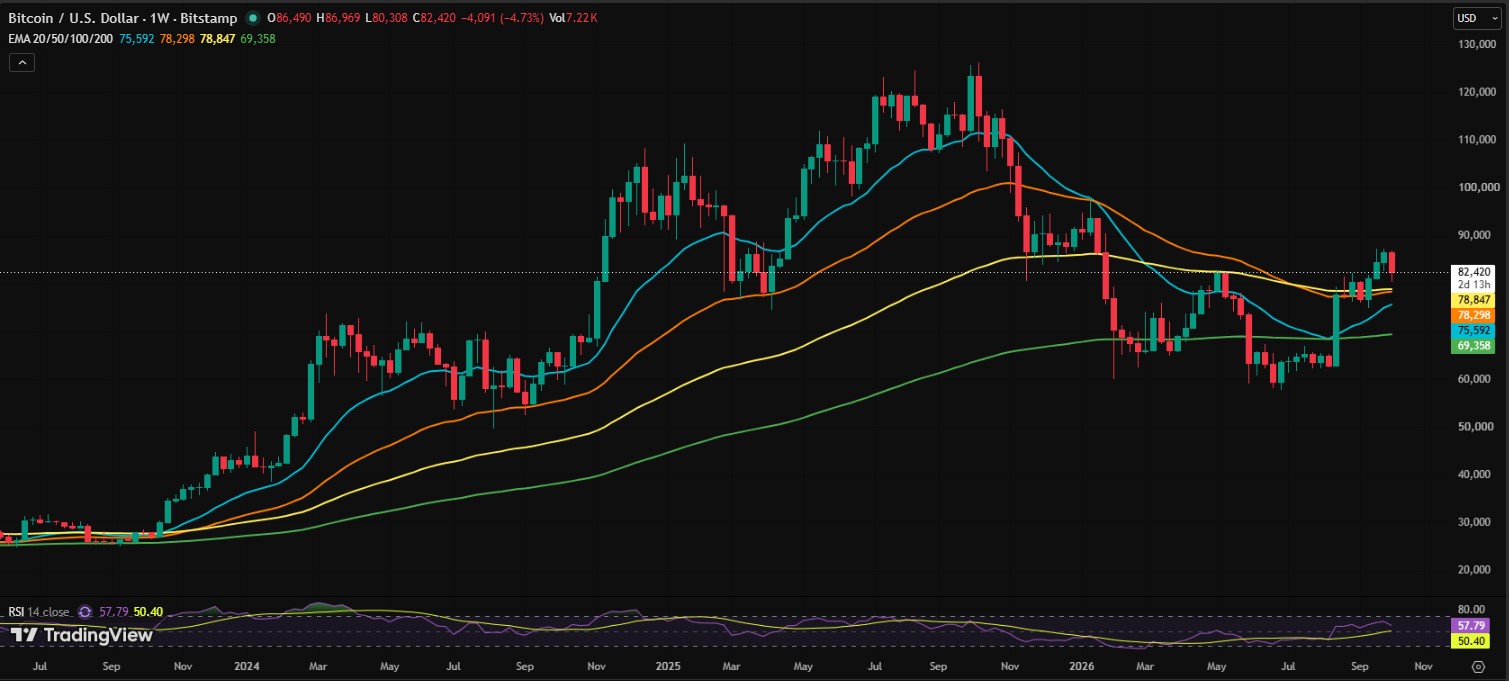
Ethereum Price Prediction: Will ETH Break $2,807?
ETH trades near $2,490 after an 8.67% weekly drop. It moves inside a long rising channel.
The 20-, 50-, 100-, and 200-week EMAs sit at $2,311, $2,419, $2,560, and $2,463. ETH is above three of them. The 100-week line is the next hurdle. RSI is 55.67, a mild positive read.
Above $2,807, the next targets are $3,000 and $3,250. A rejection could send ETH back to $2,150. The channel floor near $1,500 to $1,750 is deeper support.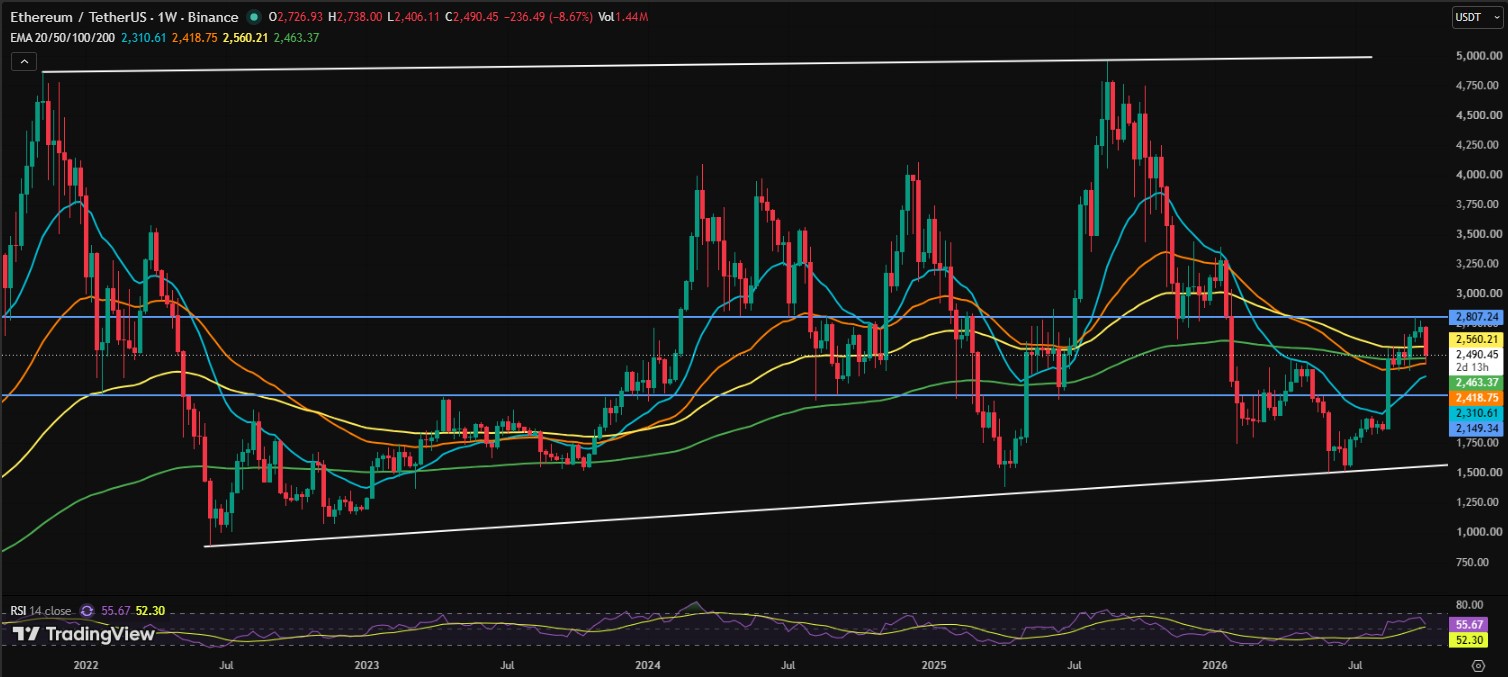
XRP Price Prediction: Is $1.33 the Level to Watch?
XRP trades near $1.39 inside a falling channel, after rejection at $1.55 to $1.60.
It sits just under the 50-day EMA at $1.398 and below the 20-day EMA at $1.456. The 100-day and 200-day EMAs are close by at $1.336 and $1.379. RSI is 42.07, which shows weak buying.
A drop below $1.35 to $1.33 may lead to $1.28 to $1.25. A move back above $1.40 to $1.46 could aim for $1.50 and $1.55.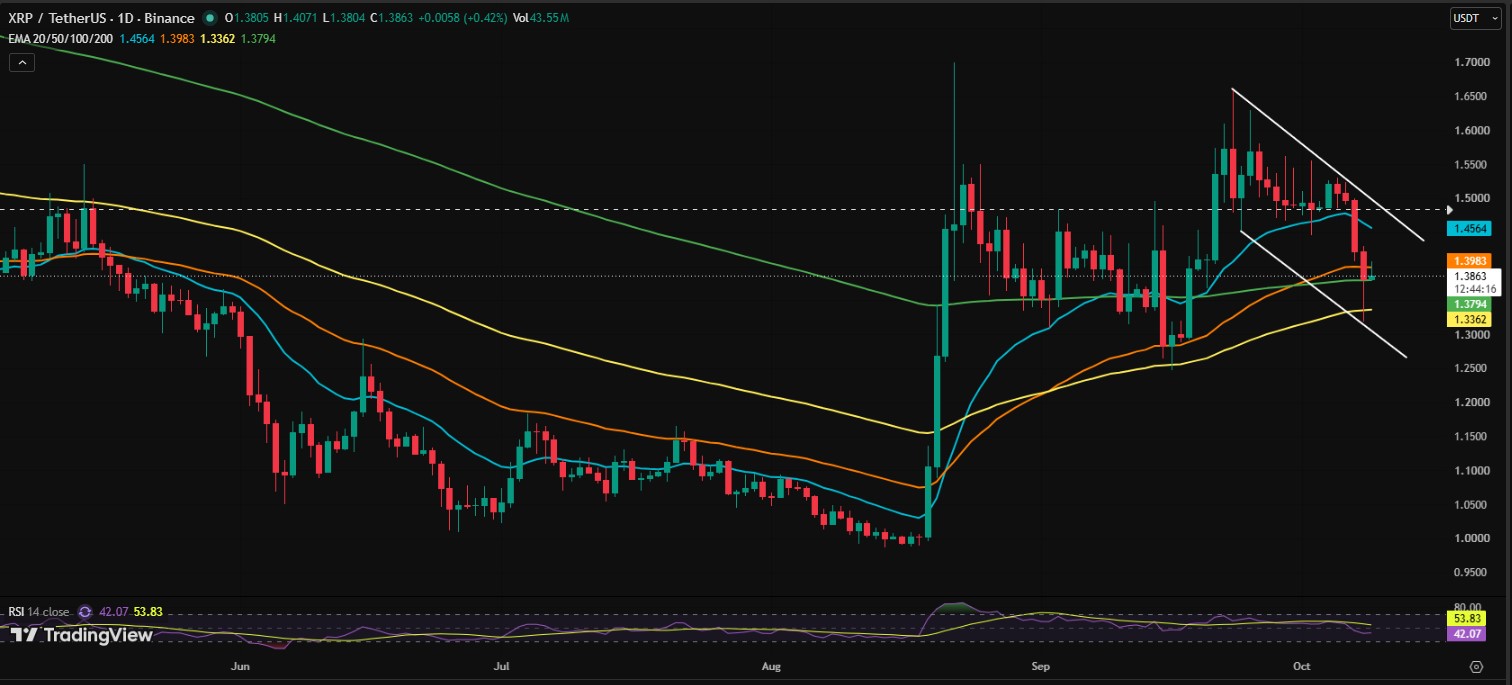
What Are the Key Support and Resistance Levels Now?
| Asset | Price | Support | Resistance |
| BTC | $82,420 | $78,000 to $75,000 | $85,000 to $90,000 |
| ETH | $2,490 | $2,310 to $2,150 | $2,560 to $2,807 |
| XRP | $1.39 | $1.35 to $1.33 | $1.40 to $1.46 |
Are Crypto ETFs Seeing Inflows or Outflows Right Now?
Mixed. Fund flows matter for any Bitcoin price outlook, because they show if big money is staying put.
Data from October 8 shows daily outflows for BTC, ETH, SOL, ZEC, and HYPE. XRP was the only name with daily inflows.
| Asset | 1-Day Net Flow | 30-Day Net Flow | Total Net Inflow |
| BTC | -$244.13M | +$1.51B | $57.11B |
| ETH | -$72.54M | +$147.30M | $13.32B |
| SOL | -$3.32M | +$241.37M | $1.59B |
| XRP | +$8.17M | +$118.63M | $1.81B |
| ZEC | -$18.66M | -$1.12M | $181.84M |
| HYPE | -$9.70M | -$7.27M | $342.00M |
Bitcoin funds hold $104.91 billion in net assets, or 6.33% of BTC's market cap.
What About Solana (SOL)?
SOL fell more than 3.85% and slipped below $110. Traders lost $63.09 million on SOL in 24 hours.
Still, SOL funds took in $241.37 million over 30 days. That is the biggest 30-day inflow after BTC in the table above.
What Is Next for Bitcoin After the Liquidations?
The next move for Bitcoin depends on two things. One is the Fed meeting on October 28. The other is whether BTC holds $78,000.
Bulls want a push above $87,000. Bears want a slip under $75,000. Nobody knows which comes first.
Disclaimer
This article is for information only and is not financial advice. Crypto is volatile, and prices can move fast. Do your own research and speak with a licensed advisor before investing. Never risk money you cannot afford to lose.

















