Why Is Solana Down Today? Grayscale Buys $20.2M SOL, Longs Liquidated


Solana is trading near $108.61, down 3.41% in the last 24 hours. The drop came with heavy long liquidations and small ETF outflows.
One number stands out, though. Grayscale's GSOL ETF has bought $20.2M of SOL over the past 20 days, with only one outflow day. Traders are asking if that buying can slow the slide.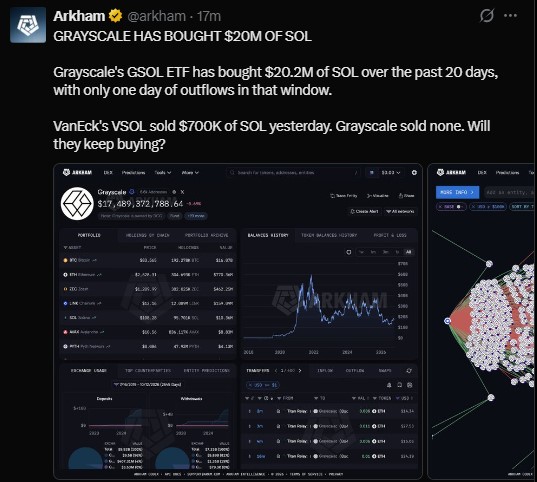
What Is the Solana Price Today?
Solana trades at $108.61, down $3.83 on the day. On the KuCoin 4-hour chart, SOL/USDT sits at $108.72 after a small bounce.
Metric | Value |
Price | $108.61 |
24h change | -3.41% (-$3.83) |
Market cap | $63.88B |
Spot volume (24h) | $845.70M |
Futures volume (24h) | $9.19B |
Open interest | $6.99B |
Circulating supply | 589.16M SOL |
Total supply | 635.72M SOL |
Futures volume is over ten times spot volume. Most of the action is in derivatives, not spot buying.
What Is Causing the Solana Price Drop Today?
Liquidations are a big part of the story. Over 24 hours, traders lost $60.36M in forced closures. Longs made up $56.25M of that.
Window | Total Liquidated | Longs | Shorts |
1 hour | $20.75K | $5.40 | $20.75K |
4 hours | $2.70M | $13.95K | $2.69M |
12 hours | $45.34M | $41.40M | $3.94M |
24 hours | $60.36M | $56.25M | $4.11M |
Look at the short windows. In the last 4 hours, shorts took $2.69M of the $2.70M total. That fits the quick bounce from the low near $102.
The 24-hour long/short ratio is 0.9249, a slight bearish tilt. Account ratios say otherwise. Binance SOL/USDT shows 2.4317, and OKX shows 2.4, so most accounts lean long.
Top traders on Binance sit at 2.6166 by accounts and 2.0639 by positions.
Open interest slipped 0.88% to $7.00B. Options volume rose 44.34% to $36.22M, and options open interest gained 12.34% to $112.82M.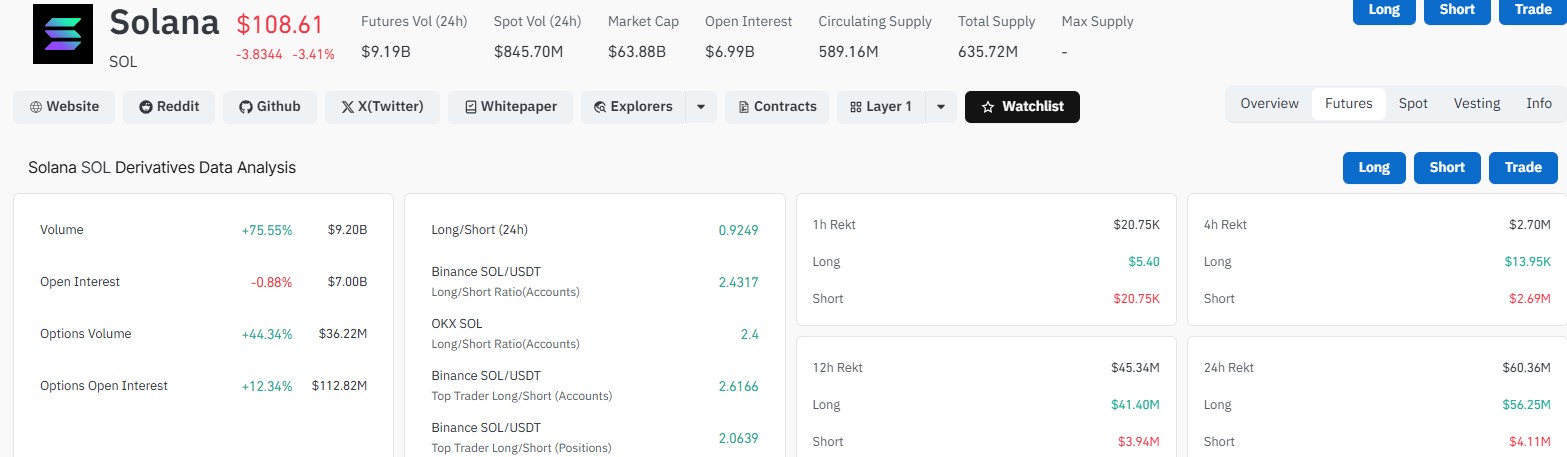
Are SOL ETFs Seeing Outflows or Inflows?
Mostly outflows lately. SoSoValue data shows a $699.83K net outflow on October 12. VanEck's VSOL had the largest outflow. Grayscale's GSOL sold none.
Date | Daily Net Flow | Cumulative Net Inflow | Value Traded | Total Net Assets |
Oct 12, 2026 | -$699.83K | $1.58B | $55.75M | $1.72B |
Oct 9, 2026 | -$3.76M | $1.58B | $54.68M | $1.73B |
Oct 8, 2026 | -$3.32M | $1.59B | $126.07M | $1.74B |
Oct 7, 2026 | -$4.80M | $1.59B | $84.65M | $1.85B |
Oct 6, 2026 | -$3.68M | $1.59B | $65.29M | $1.93B |
Oct 5, 2026 | -$9.25M | $1.60B | $65.15M | $1.93B |
Oct 2, 2026 | +$1.30M | $1.61B | $101.27M | $1.90B |
Oct 1, 2026 | -$5.91M | $1.61B | $63.50M | $1.91B |
Add up the eight sessions above, and net outflows come to about $30.12M. Only October 2 saw an inflow, at $1.30M.
Net assets fell from $1.91B to $1.72B. Outflows explain only a small part. The lower SOL price likely did the rest.
Those assets equal about 2.69% of SOL's market cap. By fund, Bitwise's BSOL leads with $1.19B in net assets. Fidelity's FSOL holds about $220.55M, and Grayscale's GSOL has $198.11M.
Will Grayscale keep buying? That is unclear. $20.2M in 20 days is small next to a $63.88B market, but steady buying during a weak week is worth watching.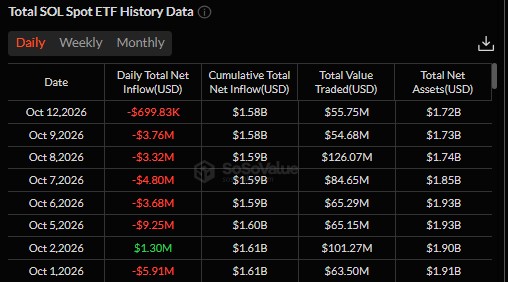
Is Solana Bullish or Bearish Right Now?
The chart looks weak. SOL was rejected near $120 to $122, lost the $116 to $118 zone, then fell hard toward $108. A wick later reached about $102 before buyers stepped in.
Indicator | Level | Price vs Level |
20 EMA | $109.96 | Below |
50 EMA | $112.53 | Below |
100 EMA | $113.87 | Below |
200 EMA | $111.39 | Below |
RSI (14) | 42.90 (signal 41.33) | Weak, not oversold |
Price is below all four EMAs. RSI is near 43, so momentum is soft but not oversold.
The pattern looks like a bearish flag or a consolidation breakdown. It still needs confirmation.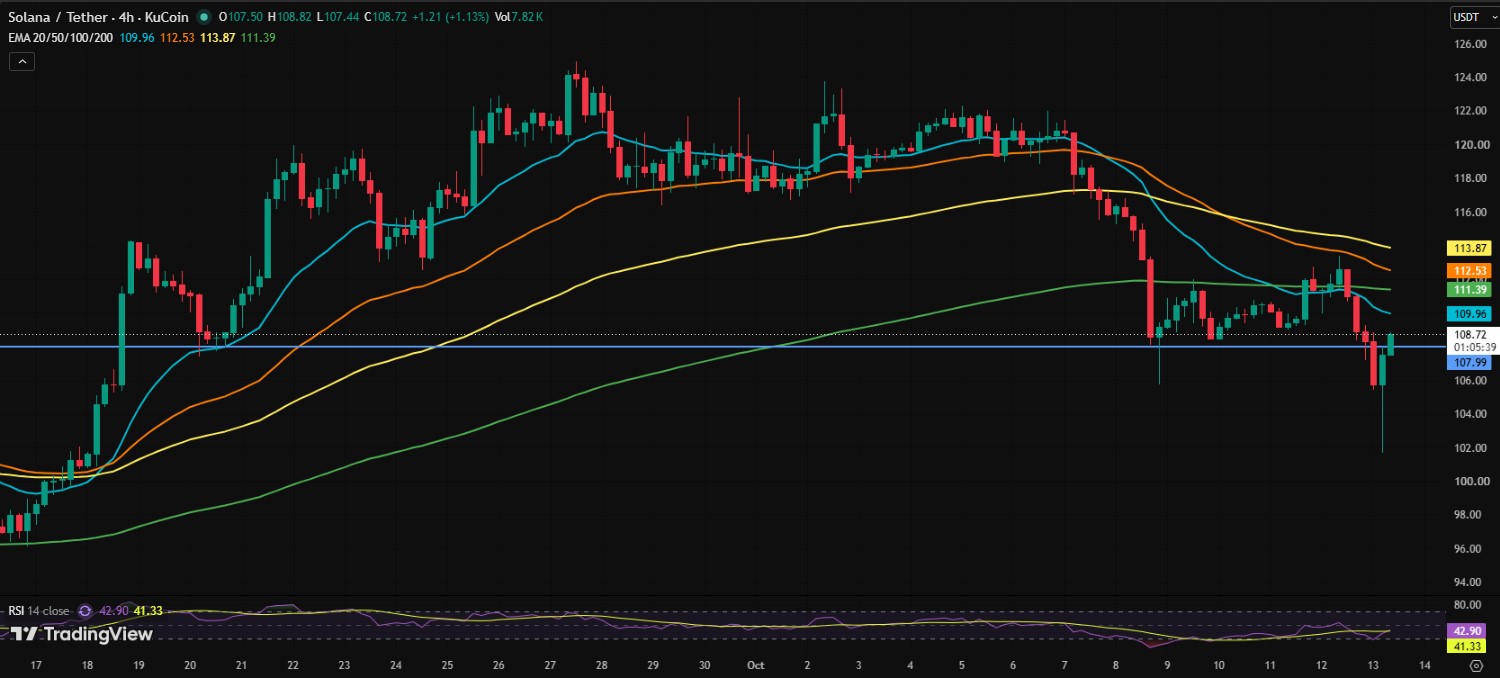
What Are the Key SOL Support and Resistance Levels?
Type | Level | Why It Matters |
Resistance | $114 | A confirmed close above weakens the bearish view |
Resistance | $112.50 to $114 | 50 EMA and 100 EMA cluster |
Resistance | $110 to $111 | First recovery zone, near 20 EMA and 200 EMA |
Support | $107 to $108 | Current support line at $107.99 |
Support | $105 | Next stop if support breaks |
Support | $102 to $103 | Recent wick low area |
Will SOL Price Go Up or Down? Scenarios to Watch
Scenario | Trigger | Possible Target |
Bearish | 4-hour close below $107 | $105, then $102 to $103 |
Sideways | Price holds $107 to $111 | Range trade, mixed signals |
Relief bounce | Sustained move above $110 to $111 | $112.50 to $114 |
The bias stays bearish below $112.50 to $114. A short bounce can happen if $107 to $108 holds. A confirmed close above $114 would weaken the bearish view, and a clear break below $107 would strengthen it.
None of this is certain. ETF flows, liquidations, and the wider market can change the picture fast.
Disclaimer
This article is for information only and is not financial advice. Crypto prices are volatile, and you can lose money. Do your own research and speak to a licensed financial advisor before you trade or invest.
Data sources: Arkham, SoSoValue, derivatives dashboard, and KuCoin SOL/USDT 4-hour chart via TradingView, as of October 13, 2026.

















