Solana Price Prediction: Is SOL Losing Steam After ETF Outflows?


Is Solana running out of buyers, or is it just catching its breath? That's the question behind this Solana price prediction, and the answer sits between $108.43 and $111.35.
SOL trades near $109 as of 07:20 UTC on October 11, 2026. The earlier October 2026 forecast treated $110 as a floor. Now it's a ceiling.
$SOL Price Today: Market Data Snapshot
A quick scan of the numbers sets the base for any SOL price prediction. Readings below reflect 07:20 UTC on October 11, 2026.
Metric | Reading |
SOL price | $109.35 |
24-hour change | -0.44% |
7-day change | -8.55% |
30-day change | +10.87% |
Market cap | $64.41B |
24-hour trading volume | $1.29B |
Circulating supply | 589.05M SOL |
That's the $SOL price today in one frame. Barely a move in 24 hours. But the weekly number stings. Price, supply, and market cap come from CoinMarketCap data, while the 7-day and 30-day moves come from CoinGlass.
Trading Volume and Market Cap
Volume dropped 41.06%. Fewer trades mean fewer people defending or attacking the current range. SOL ranks seventh by market cap. And volume equals just 2.02% of it, thin for a top-10 coin.
Why Solana Is Moving Today?
$SOL barely moved. That's the story. SOL slid from $122.29 to $105.71 within days, then froze. Sellers hit first. Buyers answered near $108.43.
A post from Solana on X said the world's biggest phone maker chose Solana. No company name. No details. Until those arrive. It's a headline, not a catalyst.
Solana ETF Outflows: Five Red Days in Six
$SOL ETF outflows reached $3.76M on October 9, 2026, per SoSoValue ETF data. That's five outflow days in the last six trading days. Cumulative inflows now sit at $1.58B. Down from $1.61B. Small numbers. But direction matters.
Solana Technical Analysis: What the 1-Hour Chart Shows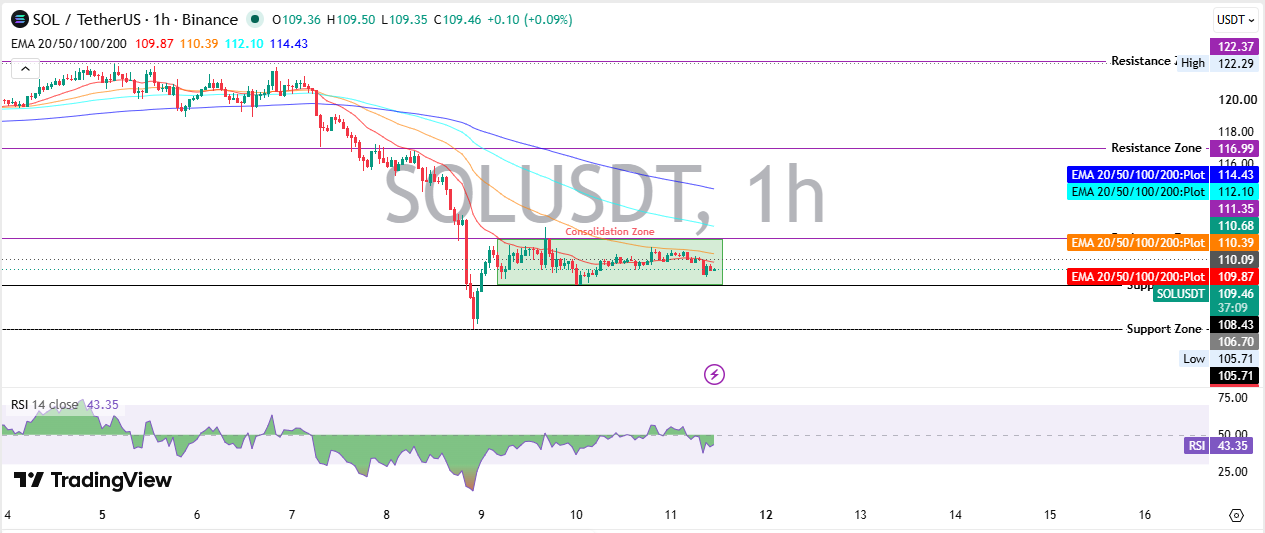
$SOL technical analysis reads recent trading data to judge who's in control. This section uses the 1-hour SOL/USDT chart on Binance.
EMA: Price Sits Under Every Line
An EMA smooths recent trades into one line, giving fresh trades more weight. The 20 EMA, 50 EMA, 100 EMA, and 200 EMAs sit at $109.87, $110.39, $112.10, and $114.43 on the 1-hour TradingView chart. SOL trades near $109.49, under all four. That's a bearish structure.
RSI: Momentum Is Soft
RSI sits at 43.35, under the midpoint but nowhere near oversold. No automatic bounce signal exists. Evidence, not certainty.
ADX: Trend Strength Is Weak
ADX measures trend strength, not direction. At 15.94, it points to a weak trend, matching the sideways box since October 9.
Solana Support and Resistance Levels
$SOL support and resistance zones frame every trade here, and the chart marks three of each.
Key Support
Support is a price area where buyers stepped in before. First support sits at $108.43, then $106.70, then the $105.71 low.
Key Resistance
Sellers wait above at $111.35, $116.99, and $122.37. And a $SOL price target near $150 only enters the conversation after $122.37 trades as support, as the $150 target analysis explains.
Derivatives Data: Crowded Longs and Liquidations
Futures volume reached $2.83B against $262.41M in spot volume, per CoinGlass derivatives data. Open interest sits at $6.78B.
The Binance long/short ratio reads 2.40. A ratio above 1 means more accounts hold longs than shorts. So who's betting on a rebound? Liquidations hit $1.72M in 24 hours, with longs absorbing $1.28M.
On-Chain Check: Whale Wallets
Solscan holder data shows the top 10 wallets control 8.72% of supply. Binance's wallet alone holds 10.57M SOL. Exchange wallets store customer coins, so big balances don't automatically point to a dump. But whale-tagged transfers deserve a watch.
Solana Price Prediction Scenarios
The near-term setup is bearish. Actually, make that stuck with a bearish tilt, since the price hasn't broken a marked floor yet. This $SOL price forecast covers three scenarios for the coming week.
Bullish Scenario
A trade above $111.35 with rising volume. That could send SOL toward $116.99, then $122.37. Returning ETF inflows would help, much like the seven-month high rally. A trade back under $108.43 cancels the idea.
Base Scenario
SOL keeps chopping between $108.43 and $111.35 while ADX stays weak. Fresh headlines in the latest crypto market news could change that quickly.
Bearish Scenario
If SOL trades below $108.43. Then $106.70 could follow, and after that the $105.71 low. A bearish price analysis covers that downside case.
Solana Price Prediction 2026: Year-End Range
Year-end hinges on one question. Whether $122.37 flips into support. SOL is down 12.10% year to date, yet up 42.34% over 90 days.
This $SOL price prediction 2026 range assumes no major shock. Bullish: $122.37 to $150 if inflows return. Base: $105.71 to $122.37. Bearish: below $105.71. The full 2026 forecast goes deeper.
Can Solana Reach $200?
Can $SOL reach $200? That needs an 83% rise from $109.35, pushing market cap near $117.81B versus $64.41B today.
And ETF outflows plus a weak ADX argue against it soon. But a 42.34% gain in 90 days shows SOL can move fast. The $200 rally analysis tracks the longer case.
Solana Price Prediction 2027 and Beyond
A 2027 forecast can't lean on a 1-hour chart. Adoption and ETF demand matter more by then, and the Solana price prediction 2027 page tracks that view.
Risks That Could Change the $SOL Price Prediction
Bitcoin sets the mood for most altcoins, so the Bitcoin price prediction deserves a read. Any $SOL price prediction carries risk. ETF outflows could grow. Crowded longs could unwind. And a weak ADX means any breakout may fail fast.
Final Takeaway
This $SOL price prediction stays bearish-tilted while SOL sits between $108.43 and $111.35. A trade above $111.35 with volume could shift that. A trade below $108.43 could confirm it.
More coin forecasts sit in the latest crypto price predictions hub.
Disclaimer: This article is for informational purposes only and isn't financial advice. Levels and scenarios rely on technical chart analysis and public data at the time of writing. Crypto markets move sharply, and past patterns don't guarantee results. Readers should do their own research before acting.

















