Why SpaceX Stock Fell 9.14% After Earnings: What Traders Watch Next


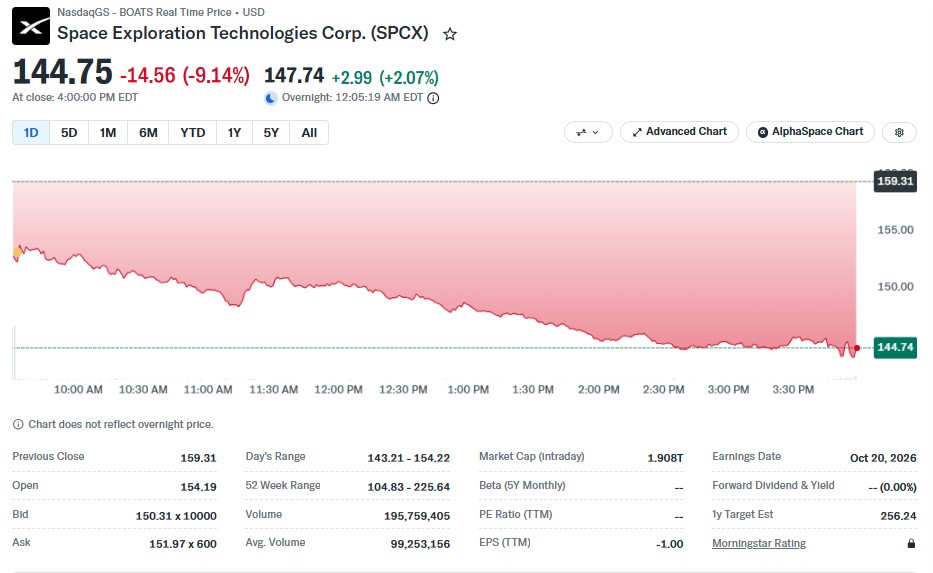
SpaceX (NASDAQ: SPCX) closed its latest session at $144.75. That is a drop of $14.56, or 9.14%, from the previous close of $159.31.
The fall came right after a strong run. Shares had jumped about 10% a day earlier on earnings news.
Overnight, the stock was up 2.07% at $147.74. So some buyers did step back in.
Why Did SpaceX Stock Fall Today?
Three things seem to have pushed the stock lower.
First, profit-taking. Traders who bought before earnings sold into the jump.
Second, a share unlock. When locked shares become available, more stock can hit the market at once.
Third, worry. Investors are talking about AI funding needs and the unclear idea of a Tesla merger.
The stock opened at $154.19 and slid through the day. Its day range was $143.21 to $154.22.
Volume reached 195,759,405 shares. That is nearly double the three-month average of 99,253,156. Heavy volume on a red day shows sellers were active.
What Happened to SPCX Stock After Earnings?
The company reported earnings of $0.35 per share. Wall Street expected $0.16.
Its "Super Intelligence" unit, once called AI, xAI and Twitter, turned profitable. Sales grew 830%, and the unit added $431 million in quarterly profit.
Still, Yahoo Finance lists trailing twelve-month EPS at -$1.00. So the long-term profit picture is not fully clean yet.
SPCX Stock Key Data at a Glance
Metric | Value |
Close | 144.75(-14.56, -9.14%) |
Overnight price | 147.74(+2.99 +2.07%) |
Previous close | $159.31 |
Open | $154.19 |
Day range | $143.21 to $154.22 |
52-week range | $104.83 to $225.64 |
Market cap | $1.908 trillion |
Volume | 195,759,405 |
Average volume | 99,253,156 |
EPS (TTM) | -$1.00 |
One-year target estimate | $256.24 |
What Is the SpaceX Cell Tower Plan?
A new Bloomberg report added fresh news. The company wants access to at least 80,000 cell tower sites across the US.
It is reportedly talking with at least one major tower company, including Crown Castle (CCI). The deals could be worth billions.
The goal is to become a fourth nationwide wireless carrier. It already bought low-band spectrum this month. It also has FCC approval for 15,000 satellites that connect directly to phones.
Next, traders will watch Starship test progress and spectrum rules for wireless networks.
What Does the SPCX Stock Chart Show?
The 4-hour chart shows a sharp pullback from the $175 to $176 area, seen in early October. Price now sits near $144.76.
It is trading close to the lower edge of a short-term ascending channel. That can hint at a bounce if buyers defend $141 to $143.
The RSI is near 40. That points to weak momentum, not an oversold panic.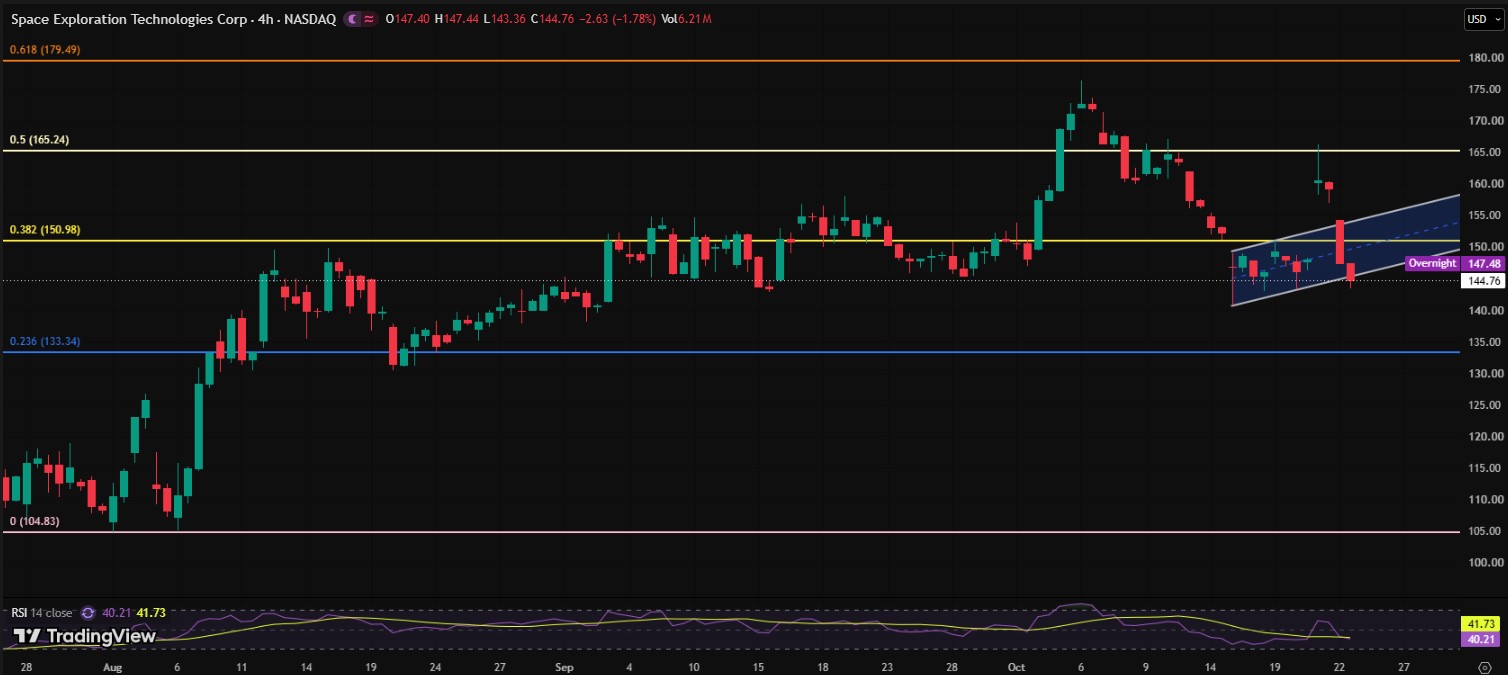
What Are the SPCX Support and Resistance Levels?
Level | Type | Note |
$179.49 | Resistance | Fib 0.618 |
$165.24 | Resistance | Fib 0.5 |
$155 to $158 | Resistance | Upper channel zone |
$150.98 | Resistance | Fib 0.382, key reclaim area |
$141 to $143 | Support | Lower channel zone |
$133.34 | Support | Fib 0.236 |
$104.83 | Support | Fib 0, base of the move |
What Is Next for SPCX Stock?
The near-term view is neutral to bearish. It stays that way unless price reclaims $150 to $151.
A rebound above that zone could open a path toward $155 to $158. A stronger breakout might retest $160 to $165.
A break below $141 could cancel the channel setup. That would put $133 in focus.
No one knows which way it goes. Earnings strength is real, but so are the unlock pressure and the Tesla questions. A confirmed channel breakout or breakdown will likely decide the next big move for SpaceX Stock.
Disclaimer
This article is for information only. It is not financial, investment, or trading advice. Stock prices can rise or fall fast, and you can lose money. Technical levels are not guarantees. Do your own research and speak with a licensed financial advisor before you invest.

















