Zcash Price Prediction: ZEC 3X Faster Blocks! Can It Hit $2K Target?


Zcash is lining up faster blocks, and a post says money is flowing back into spot ETFs. Will that lift ZEC? Not by itself. Both items are unconfirmed, and the price sits inside a range below $1,312.12 resistance.
This Zcash Price Prediction checks the NU7 and ETF posts, the liquidation data and the daily chart.
Market data checked on October 23, 2026, at 09:39 IST.
Zcash Price Prediction Today: Market Overview
Metric | Value |
Price (TradingView daily chart) | $1,223.65 |
Daily Candle Change | -5.50% |
Candle Open | $1,218.00 |
Candle Range | $1,210.33 – $1,241.07 |
Why is ZEC’s price down today?
The Zcash price today is down 5.50% to $1,223.65 in 24 hours, underperforming a broader market decline primarily driven by a tech-led risk-off move across assets. The drop shows ZEC trading with high sensitivity to Bitcoin's downturn, amplified by derivatives positioning and a break below key technical support.
Primary reason: Broader market sell-off triggered by weak tech earnings and geopolitical tensions, pressuring risk assets like crypto.
Secondary reasons: Derivatives pressure from leveraged long liquidations and a technical breakdown below the 50-day EMA.
Zcash News Today: Zebra 7.0.0 Brings NU7 Closer
A crypto account on X posted that the Zcash Foundation released Zebra 7.0.0, the first stable node software to support Network Upgrade 7 (NU7). Node software is the program that runs a copy of the blockchain.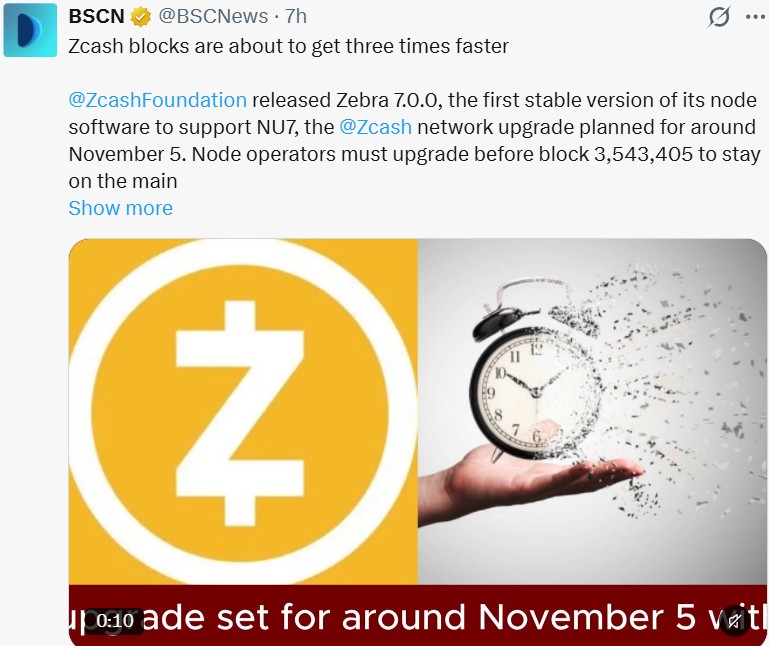
The post says NU7 is planned for around November 5, and operators must upgrade before block 3,543,405. It also says block time, the gap between blocks, drops from 75 to 25 seconds.
That block height matches Zcash's official X post from October 22. CoinGabbar could not verify the other details.
Zcash ETF Inflows: $15.18M Reported
Zcash ETFs saw 15.18 Minnet in flows yesterday,taking the weekto+6.34M. An ETF, or exchange-traded fund, is a fund that trades on a stock exchange, and net inflow means more money came in than went out.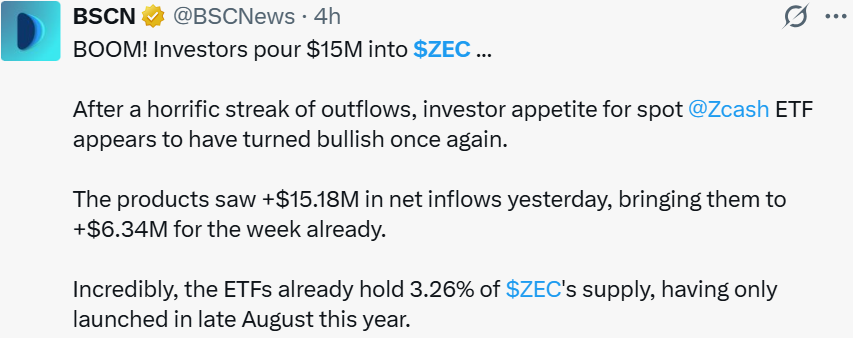
Source: Data From X
The post names no funds or data source, so CoinGabbar could not verify the figures.
Zcash News: ZEC Liquidation and Futures Volume
A liquidation happens when an exchange force-closes a leveraged trade because the trader can no longer cover losses. Longs bet on a rise, and shorts bet on a fall. Coinglass shows:
Window | Total Liquidated | Long | Short |
1h | $38.11K | $33.50K | $4.61K |
4h | $583.75K | $204.07K | $379.68K |
12h | $3.94M | $2.98M | $959.41K |
24h | $10.56M | $8.71M | $1.86M |
Source: Data From CoinGlass
Longs took about 82% of the $10.56M liquidated over 24 hours. Shorts led the 4-hour window with about 65%, which points to a choppy market.
Coinglass futures volume leads with Binance at $2.09B, MEXC at $1.88B and OKX at $1.31B. The screenshot gives no time window.
Zcash Outlook: ZEC Make or Break Situation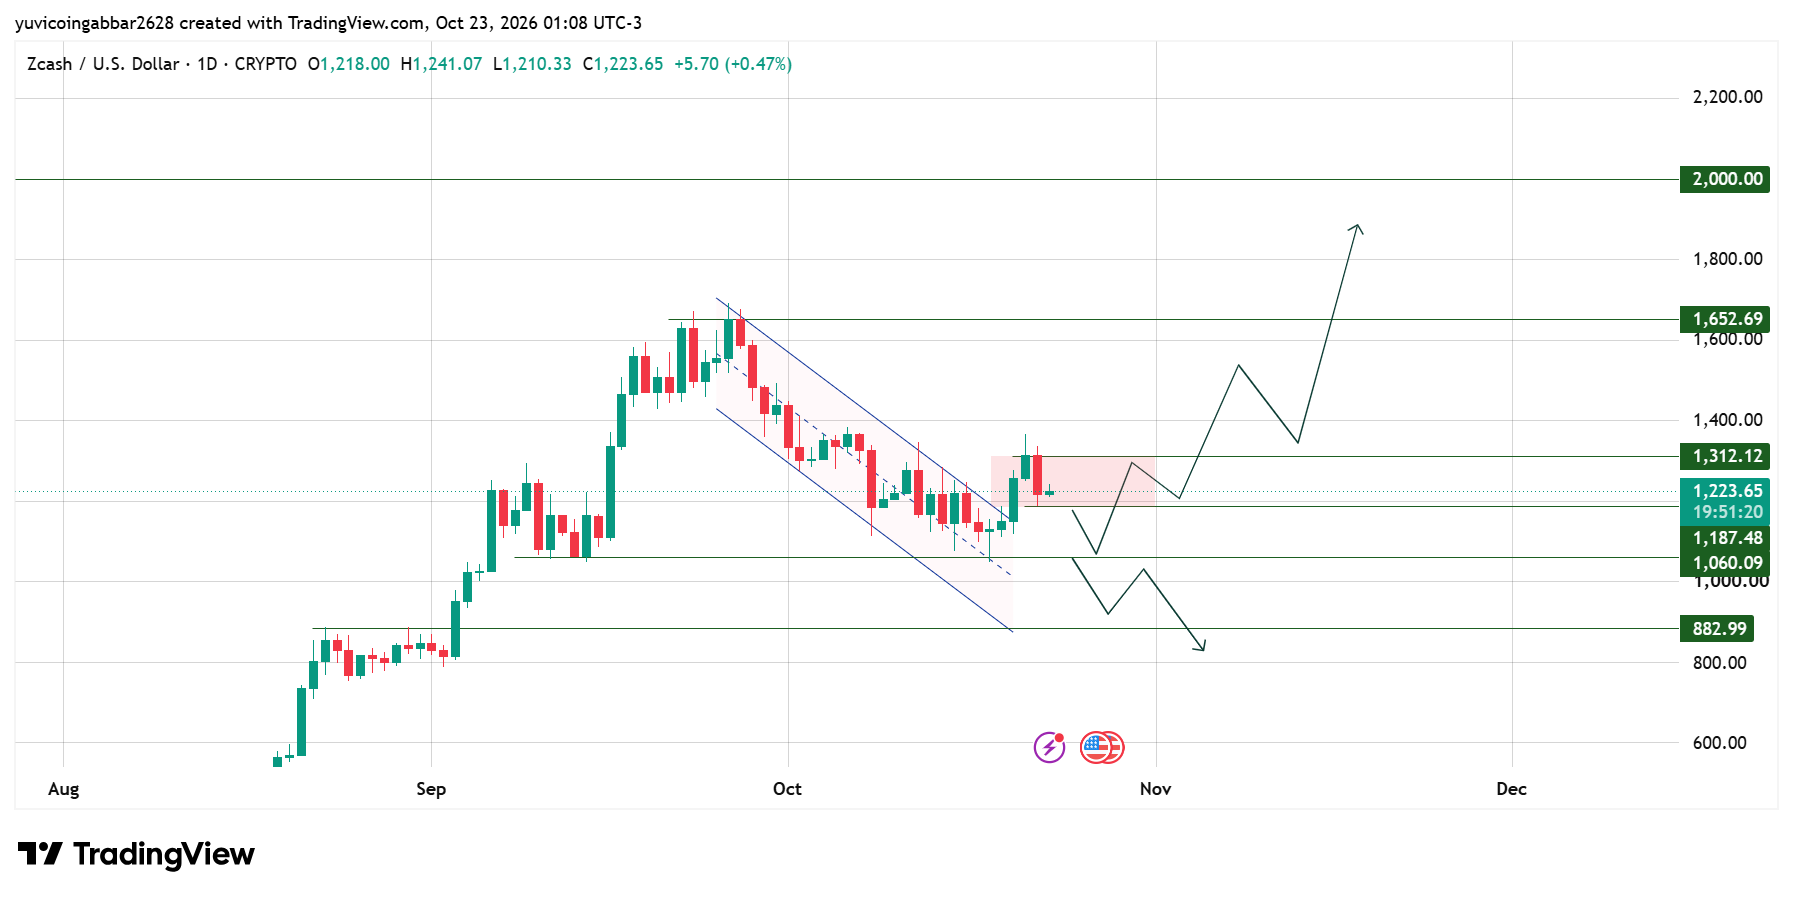
A channel is a pair of sloping trend lines that hold price inside a range. ZEC broke out of a falling channel in recent days, ran into the $1,312.12 level and pulled back.
Today's candle opened at $1,218.00, ranged from $1,210.33 to $1,241.07 and traded at $1,223.65, inside the shaded zone between $1,187.48 and $1,312.12.
A retest is a pullback toward a level that price just broke through. Holding the zone's lower edge keeps that retest intact. A move back below it would suggest the breakout is failing.
Zcash Forecast: IMP Key Target Levels
Type | Level |
Highest marked level | $2,000.00 |
Resistance 2 | $1,652.69 |
Resistance 1 | $1,312.12 |
Immediate support | $1,187.48 |
Deeper support | $1,060.09 |
Further support | $882.99 |
Bull case: A daily close above $1,312.12 while $1,187.48 holds would turn the range into a base and open $1,652.69.
Bear case: If ZEC closes below $1,187.48, the retest fails, and the price could slide to $1,060.09, with $882.99 below that.
ZEC Scenarios and Invalidation (October 23, 2026)
Scenario | Trigger | Likely Outcome | Invalidation |
Bull | Close above $1,312.12 | Move toward $1,652.69 | Close below $1,187.48 |
Base | Range of $1,187.48 to $1,312.12 | Sideways inside the zone | Break of either level |
Bear | Close below $1,187.48 | Slide toward $1,060.09, then $882.99 | Close back above $1,187.48 |
Zcash Price Prediction: Can Zcash Reach $2,000?
It would take a gain of about 63% from $1,223.65. A Zcash price prediction at that level needs more than headlines, since ZEC must clear $1,312.12 and $1,652.69 first. Faster blocks and ETF flows may add interest, but neither is proven.
Zcash Price Prediction 2026: Expert View
On the 4-hour timeframe, price has broken a key trendline, shifting short-term momentum to bearish. For the bullish continuation to remain valid, price must hold the 1,187 level, which also acts as a retest zone of the channel pattern.
A breakdown below 1,187 would put 1,060 in focus as the make-or-break support: holding it keeps the bullish structure intact, while a decisive break below could open the door to a sharp decline.
The base case is sideways while the price sits between $1,187.48 and $1,312.12, so a daily close outside that range would be the first clear signal.
Disclaimer
This article is for informational purposes only and isn't financial advice. Crypto markets are volatile. Always do your own research before making any trading decisions involving ZEC.

















