XDC Price Prediction: Can Buyers Reclaim $0.03068 This Week?


Can buyers reclaim the resistance level at $0.03068, a price where sellers have capped rallies, or will the bounce fade?
This XDC price prediction begins with XDC Network trading well below its early October highs. Sellers still run the daily chart. An earlier XDC analysis covered the volume rebound setup that came before this slide. The bounce now faces a test of whether it can last.
Where Does XDC Stand Right Now?
CoinGecko market data shows XDC Network ranked 91th by market cap. Price is up 0.9% on the day and sits midway through a tight 24h range.
Metric | Value |
Price | $0.02982 |
24h change | +0.9% |
24h range | $0.02905 to $0.03025 |
Market cap | $591.339M |
Market cap rank | 91th |
Fully diluted valuation (FDV) | $1.128B |
Outstanding token value | $947.654M |
24h trading volume | $13.358M |
Circulating supply | 19.947B XDC |
Perps 24h open interest | $2.609M |
Source: CoinGecko, XDC Network market snapshot, captured Nov 17, 2026, 07:30 UTC
fully diluted valuation, prices every token in total supply at today's rate. It sits at $1.128B against a $591.339M market cap, so a large share of supply isn't circulating yet.
What Is Happening With XDC Open Interest?
Open interest is the total value of futures positions that are still open. CoinGlass futures data puts total open interest at $3.6M across exchanges. That's down 10.4% from $4.1M over the period shown.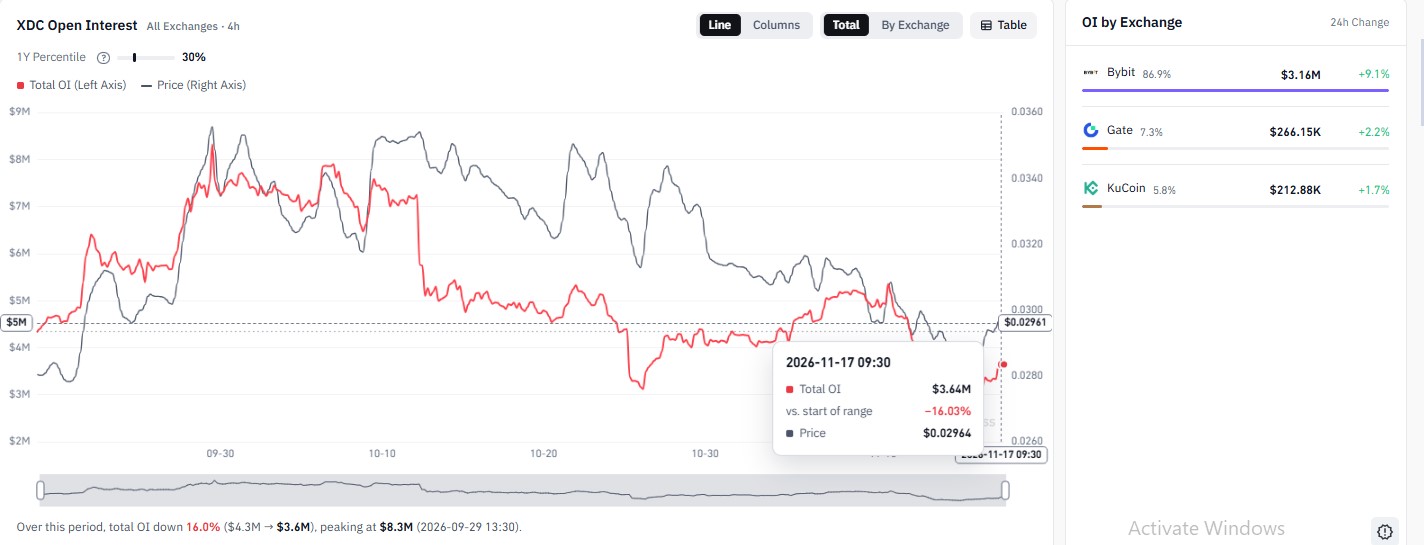
Source: CoinGlass, XDC open interest, all exchanges, 4h, captured Nov 17, 2026, 07:30 UTC.
Open interest rose alongside price, which means traders are adding positions into the bounce. That matters for this XDC price prediction, because more positions can speed up a move once a level breaks. A daily candle trading above $0.03088 would favor buyers, while a break below $0.02734 would turn fresh longs into forced exits.
What Does the Chart Say About This XDC Price Prediction?
The Poloniex daily chart for XDC/USDT on TradingView frames this XDC price prediction. A rally pushed XDC up to $0.03551 level before sellers took control.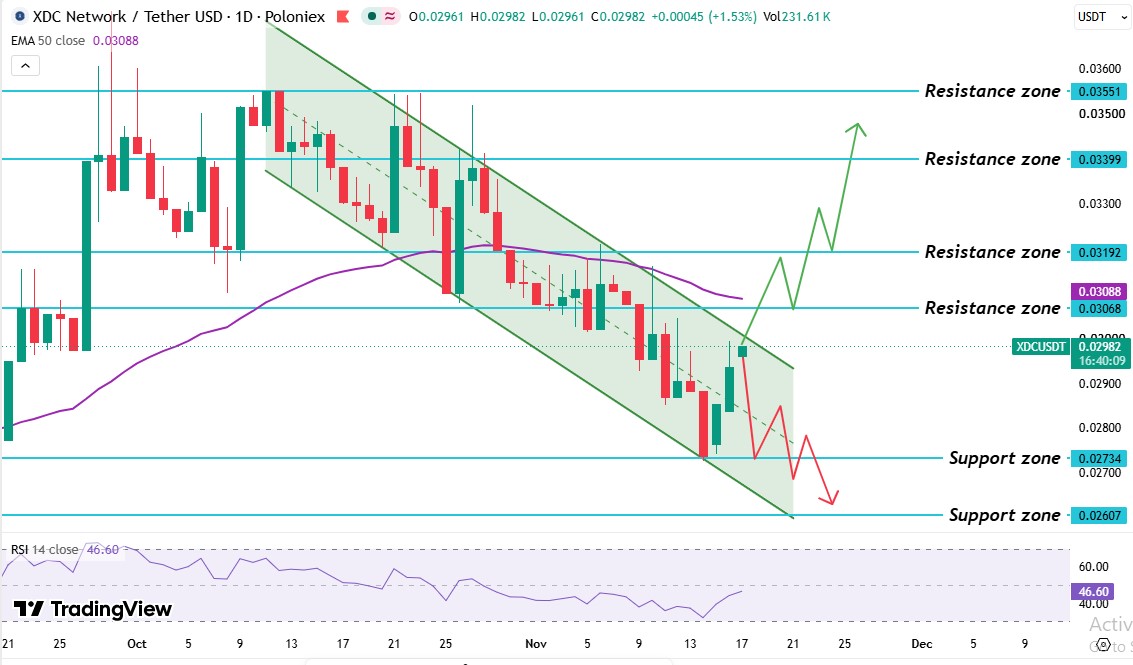
Source: TradingView, XDC/USDT 1D Chart, captured Nov 17, 2026, 07:30 UTC
The climb began from the $0.03068 support level, a price where buyers have stepped in before. Buyers cleared the $0.03192 resistance level, a price where sellers have capped rallies and pushed into $0.03551. The market tried that top several times and failed. Sellers then took over, and the price lost the 50-day EMA level. The $0.03068 level gave way next. It flipped into a resistance level.
The latest wick came off the $0.02734 support level, where buyers defended. The chart shows a falling channel, a pair of downward-sloping lines that hold price between a lower and an upper edge. A break above the upper line points to a shift in direction, while a break below the lower line opens the way to $0.02607.
Fresh crypto news can stir short moves, but a daily candle trading above the upper trendline matters more than a single wick. Right now, the price trades above the $0.02734 support level and below both the $0.03068 resistance level and the 50-day EMA.
The XDC 50-day EMA sits at $0.03088. XDC's $0.02982 price trades below it, and the EMA sits 4.1% above that price. The latest daily candle also trades below the EMA, and the channel's upper line sits right beside it, so a real recovery needs a daily candle trading above both.
The XDC RSI reads 46.60 on the 14-day setting. Under 50 means sellers hold the edge, and above 50 means buyers do. A reading above 30 means oversold conditions haven't formed, so the price has room to fall.
XDC Support and Resistance Levels
Level | Type |
$0.03551 | Resistance level |
$0.03399 | Resistance level |
$0.03192 | Resistance level |
$0.03088 | 50-day EMA |
$0.03068 | Resistance level |
$0.02734 | Support level |
$0.02607 | Support level |
A support level is a price where buyers have stepped in before, and a resistance level is where sellers have capped rallies. The nearest levels are $0.03068 above and $0.02734 below.
XDC Price Forecast: Bull, Base, and Bear Scenarios
Scenario | Trigger | Target | Invalidation |
Bull | Daily candle trades above $0.03068 | $0.03192 then $0.03399 | Falling back below the $0.03068 |
Base | Price stays between $0.02734 and $0.03068. | Sideways trade inside that range | Daily candle breaking either level |
Bear | Daily candle trades below $0.02734 | $0.02607 support level | Daily candle trades above the $0.03068 |
A regulatory delay or a market-wide sell-off could push the price through $0.02734 fast. Falling open interest would show traders closing positions rather than adding them. And a failed push at the EMA would put the lower edge of the channel back in play. A daily candle trading above $0.03088 cancels the bear case.
Can XDC Reach $0.05 From Here?
Reaching $0.05 needs a 68.6% gain from $0.02982. The price must first clear the $0.03068 resistance level and the 50 EMA at $0.03088. Next come $0.03192 and $0.03399. The last hurdle is $0.03551.
The chart's peak stayed well below $0.05, so this XDC price prediction target has no recent precedent. And open interest at $3.6M shows little positioning behind such a large move.
What Is the Expert Outlook on XDC Levels?
According to CoinGabbar analysis, the XDC price prediction leans bearish while the price trades under the EMA. RSI sits at 46.60, and every rebound stalls inside the falling channel. But open interest rebuilt from its lows, so the bounce isn't empty, and buyers have held the $0.02734 support level once already. The condition to monitor is a daily candle trading above $0.03088, which flips the read from bearish to neutral. A daily candle trading below $0.02734 confirms the lower targets.
Disclaimer: This article is for information only and isn't financial advice. Traders should do their own research and risk only what they can afford to lose.