XRP Flashes Buy Signal Ahead of Fed Decision: Is $1.25 the Key Level?

XRP is extending its recovery on Wednesday, October 28, 2026. It trades near $1.3365, up 2.87% in 24 hours.
The move follows news that Ripple got approval from U.S. authorities to set up a national bank.
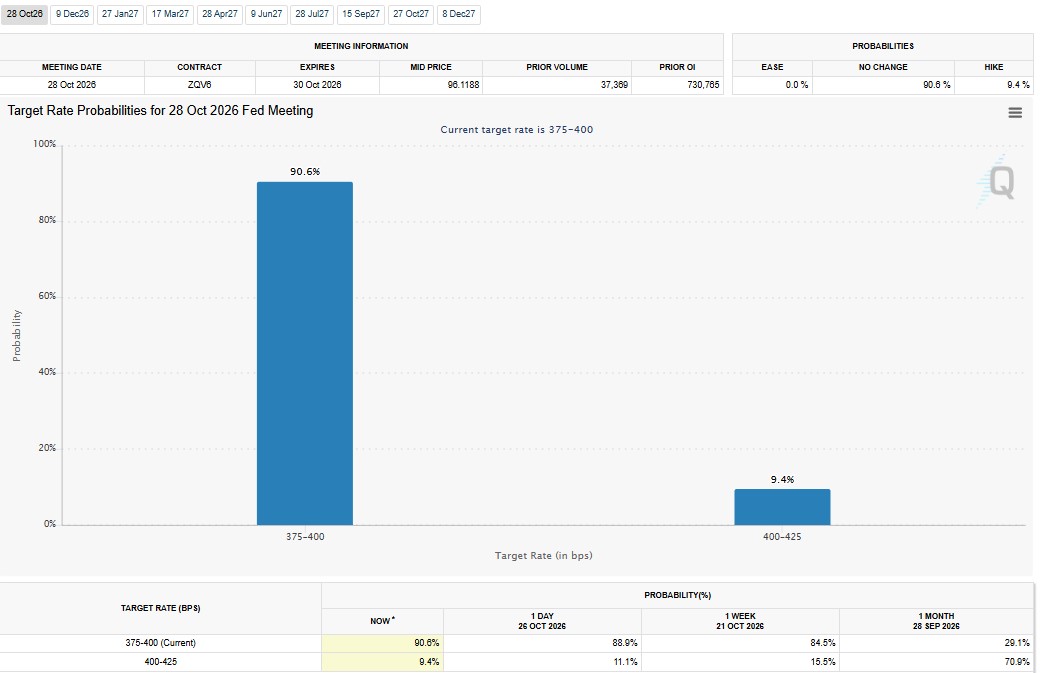
Traders are also watching the FOMC rate decision at 2:00 PM ET. Warsh's press conference follows at 2:30 PM ET.
What Are the Odds for the Fed Decision Today?
Why Is XRP Going Up Today?
Two things are helping XRP. The bank approval is a clear positive for sentiment. Buying pressure on exchanges has also improved.
The Fed event adds risk. Big rate news can move the whole crypto market fast, so volatility may stay high.
What Are the Current XRP Market Numbers?
| Metric | Value |
| Price | $1.3365 |
| 24-hour change | +2.87% (+$0.03729) |
| Futures volume (24h) | $2.31B |
| Spot volume (24h) | $397.77M |
| Market cap | $84.79B |
| Open interest | $3.02B to $3.03B |
| Circulating supply | 63.35B |
| Total supply | 99.98B |
| Max supply | 100.00B |
What Does the XRP Taker Buy/Sell Ratio Show?
Binance data from Arab Chain shows the Taker Buy/Sell Ratio at about 1.076. That is its highest level in three months.
A reading above 1 means aggressive buy orders are beating sell orders. It hints at better buying pressure.
Still, the ratio has swung up and down since April. One reading is not a trend. Traders will want price and volume to confirm it.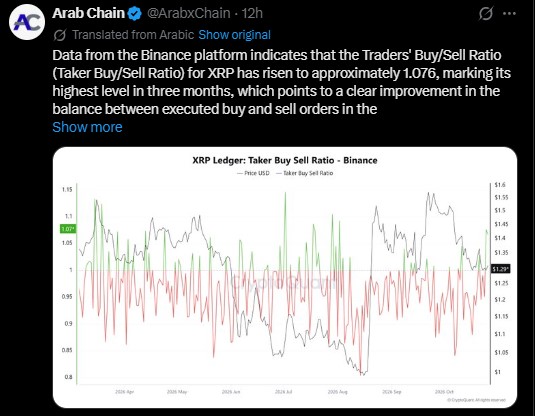
Is the Crypto Derivatives Market Bullish or Bearish?
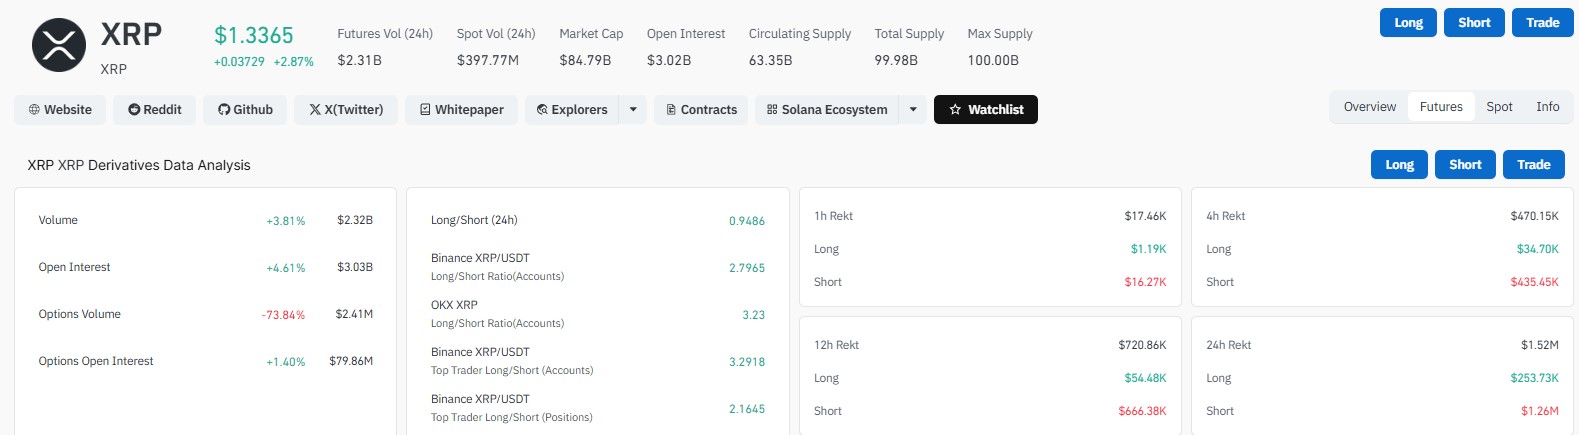
Open interest rose 4.61% to $3.03 billion. More traders are active in futures.
The overall 24-hour long/short ratio is 0.9486. That is a slight lean toward shorts. Account-based ratios on Binance and OKX look more bullish.
Options tell a quieter story. Volume fell 73.84% to $2.41 million. That points to far fewer options trades than before.
Options open interest still rose 1.40% to $79.86 million. So existing bets are growing a little, even as new trading slowed.
The mix of signals means sharp moves are still possible.
| Derivatives Metric | Reading |
| Long/Short ratio (24h, overall) | 0.9486 |
| Binance XRP/USDT accounts | 2.7965 |
| OKX XRP accounts | 3.23 |
| Binance top traders (accounts) | 3.2918 |
| Binance top traders (positions) | 2.1645 |
| Futures volume | $2.32B (+3.81%) |
| Open interest | $3.03B (+4.61%) |
| Options volume | $2.41M (-73.84%) |
| Options open interest | $79.86M (+1.40%) |
How Many Liquidations Hit XRP Traders?
Shorts took more pain. In 24 hours, $1.26 million of the $1.52 million total came from short positions.
| Period | Total | Long | Short |
| 1 hour | $17.46K | $1.19K | $16.27K |
| 4 hours | $470.15K | $34.70K | $435.45K |
| 12 hours | $720.86K | $54.48K | $666.38K |
| 24 hours | $1.52M | $253.73K | $1.26M |
What Is the TD Sequential Buy Signal?
Ali Charts says the TD Sequential flashed a buy signal on the XRP 3-day chart. The last three similar signals led to rebounds of 31%, 24%, and 18%.
The latest candle on the chart carries a 9 marker. That is the count that completes the setup.
The chart also marks a 71.88% jump from the August low. Past results do not guarantee what comes next.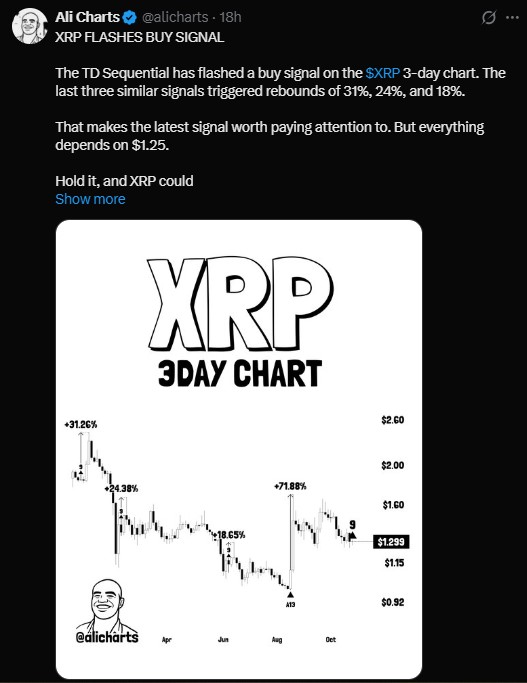
| Past Signal Move | Rebound Marked on Chart |
| Earlier signal 1 | +31.26% |
| Earlier signal 2 | +24.38% |
| Earlier signal 3 | +18.65% |
| August low | +71.88% |
If $1.25 holds , a rebound toward $1.40 is possible. If it breaks while whales keep taking profits, $0.98 could be next.
What Is the Inverse Head and Shoulders Pattern?
On the daily chart, Ali Charts sees a possible inverse head-and-shoulders bottom. The right shoulder may be forming near $1.25.
The left shoulder formed earlier, around June. The head came in August, when price hit its lowest point on the chart, below $1.15.
After that low, price climbed back to the $1.55 area. It then slipped again toward $1.32, where the right shoulder may be taking shape.
The neckline sits at $1.55. A daily close above it could open a path toward $2.10.
If $1.25 breaks instead, the pattern fails and $0.98 comes into focus.
It is only a pattern so far. It needs confirmation.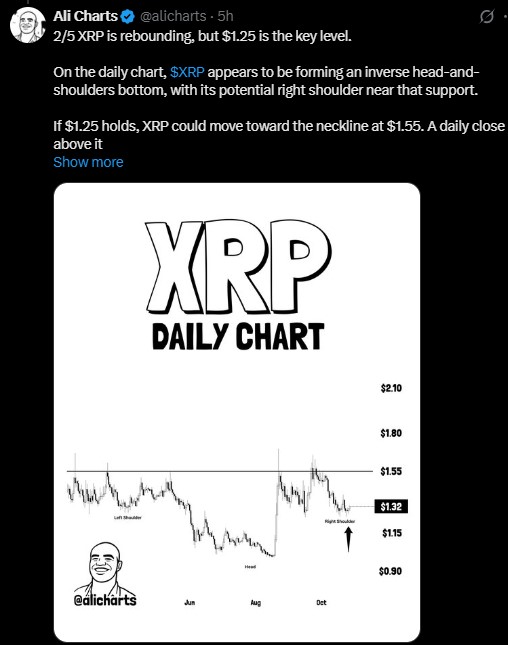
What Are the Key Support and Resistance Levels?
| Level | Why It Matters |
| $2.10 | Breakout target after a daily close above $1.55 |
| $1.55 | Neckline and main resistance |
| $1.40 to $1.45 | Rebound target and possible liquidity sweep zone |
| $1.3365 | Current trading price |
| $1.25 | Key support for the right shoulder |
| $0.98 | Downside level if $1.25 breaks |
What Is a Liquidity Sweep, and Could It Happen Next?
One chart idea shows a final liquidity sweep into the $1.40 to $1.45 zone. Price would push into that area, trigger orders, then pick a direction.
It is one possible path. It is not a sure thing.
What Should Traders Watch Next?
A few things matter in the short term:
-
Whether $1.25 holds on any dip.
-
Whether the taker ratio stays above 1.
-
Whether open interest keeps rising with price.
-
Whether short liquidations continue to build.
A daily close above $1.55 would be the biggest test for XRP. Until then, the range between $1.25 and $1.55 is where most of the action may stay.
Will XRP Go Up After the FOMC Decision?
Nobody can say for sure. Rate decisions often cause fast swings.
The signals lean positive for now. Still, derivatives data is mixed, and $1.25 is the line many traders are watching. The reaction to the Fed will likely set the tone.
This article is for information only. It is not financial, investment, or trading advice. Crypto is highly volatile, and you can lose money. Past signals do not guarantee future results. Do your own research and speak to a licensed financial advisor before investing.



















