Sui Price Prediction: Can Tokenized Gold News Spark A Wedge Breakout?


Interest in the latest Sui price prediction is growing after a Hong Kong regulated tokenized gold product was deployed on the network.
The $SUI coin is still down 2.5% over the last 24 hours, so the market has not yet followed the news. SUI now trades near $0.9125, and traders want to know whether real-world asset activity can change the mood.
Sui is a layer-1 blockchain built by Mysten Labs, a company founded by former Meta engineers, and its mainnet launched in May 2023.
According to CoinGecko, Sui price today is $0.9125, within a 24-hour range of $0.8995 to $0.9604. SUI ranks 30th by market capitalization at about $3.758 billion.
Live Sui Market Data
| Metric | Value |
| Price | $0.9125 |
| 24h Change | -2.5% |
| 24h Range | $0.8995 to $0.9604 |
| Market Cap | $3.758B |
| Market Rank | #30 |
Source: CoinGecko, as of October 29, 2026.
Sui News Today
Sui news today centers on tokenized gold. According to BSCN Newswire, AlphaToken has deployed XAUa on the Sui network under the Permissioned Asset Standard.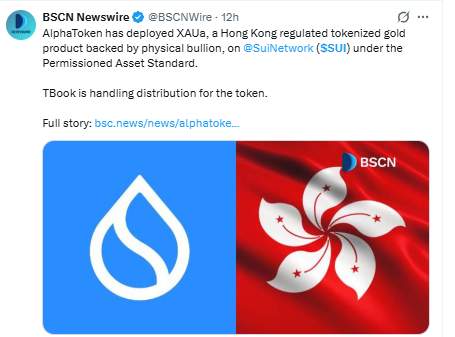
Source: Data Taken From @BSCNWire, as of October 29, 2026.
The product is regulated in Hong Kong and backed by physical bullion.
The report adds that TBook is handling distribution for the token. The post gave no figures on supply or trading activity, so traders can treat the news as a sentiment factor, not a confirmed demand driver.
Sui Technical Analysis
This Sui price prediction October 2026 reads the daily SUI/USDT chart on Binance. Price moves inside a falling wedge.
The pattern formed after $SUI rose from about $0.68 on September 15 to a peak near $1.30 on September 27 and 28.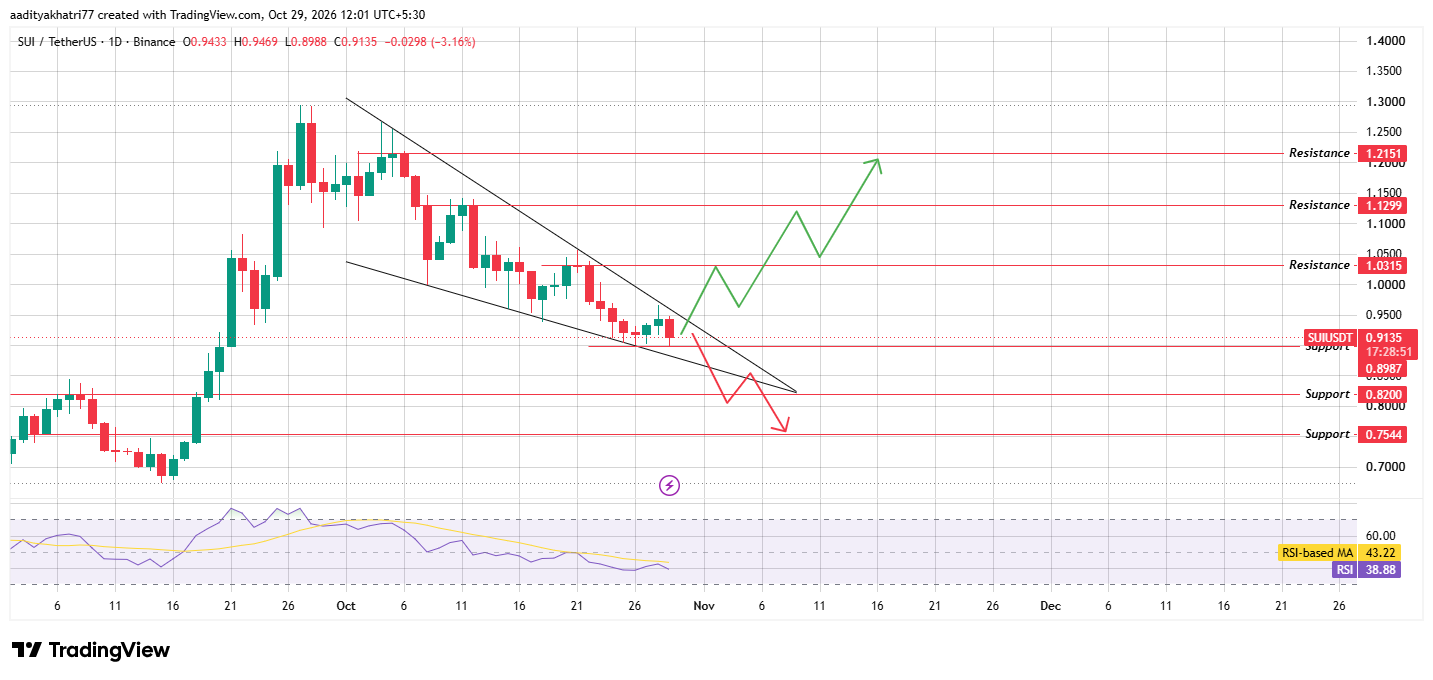
Source: TradingView, SUI/USDT 1D , Binance, as of October 29, 2026.
Since early October, each rally has stopped at a lower high and each pullback at a lower low.
That sequence created the narrowing shape of the wedge. A falling wedge often resolves upward, yet it can also fail, so confirmation matters.
Price now sits near the lower boundary and the $0.8987 level. Today's candle opened at $0.9433, dipped to $0.8988 and trades near $0.9135, a decline of 3.16%.
The RSI reads 38.88 against its average of 43.22, which shows soft momentum, although it remains above the 30 oversold line.
Can $SUI Bounce and Break the Falling Wedge Trendline?
The bullish case begins with a hold. $SUI needs to defend $0.8987 and the lower boundary of the wedge, since a bounce from that area would show that sellers are losing strength.
The next step is a daily close above the falling upper trendline of the wedge, which currently sits near $0.96.
That close should come with volume above the 20-day average. A close on weak volume would carry less weight, because rallies inside the wedge have failed before.
After a confirmed break, $1.0315 is the first resistance, followed by $1.1299 and $1.2151. The $1.2151 level sits just under the early October high near $1.26, so sellers may appear again in that area.
What Happens If $SUI Breaks the Support and Wedge Trendline?
The bearish case starts when the bounce fails. If $SUI closes a daily candle below both the lower wedge trendline and $0.8987 on above-average volume, the pattern would fail instead of resolving upward.
In that case, $0.8200 is the first support, followed by $0.7544. Both levels sit above the mid-September low near $0.68.
A brief move under the trendline is not enough. If price closes back above it within a day or two, the move may prove a false break, and the wedge would remain intact.
Price Levels to Watch
| Support | Resistance |
| $0.8987 | $1.0315 |
| $0.8200 | $1.1299 |
| $0.7544 | $1.2151 |
Bull, Base, and Bear Scenarios for Sui Price Prediction
| Scenario | Setup | Level |
| Bull | $SUI holds the lower edge of the wedge, then a daily candle closes above the upper trendline with volume over the 20-day average | $1.0315 first, then $1.1299 and $1.2151 |
| Base | $SUI stays inside the wedge with no daily close beyond either boundary, between $0.8987 and the upper trendline near $0.96 | Between $0.8987 and $0.96 |
| Bear | A daily candle closes under $0.8987 and the lower trendline while selling volume runs above the 20-day average | $0.8200 first, then $0.7544 |
Sui vs Bitcoin
Any Sui price prediction 2026 should check how SUI trades against Bitcoin. Over the last 24 hours, SUI is down 2.5% in dollars and down 1.4% against Bitcoin.
Together, those figures imply that Bitcoin lost about 1.1% in dollar terms.
$SUI therefore fell more than Bitcoin, which shows relative weakness. That weakness does not break the wedge by itself, but it raises the importance of $0.8987 on a daily close.
Methodology
This Sui price prediction draws on three inputs. Market data comes from CoinGecko and was taken on October 29, 2026.
The chart is a daily SUI/USDT view from Binance in TradingView, with timestamps in UTC+5:30. The news item comes from a single BSCN Newswire post.
Support and resistance levels were read directly from the chart. The wedge boundaries carry no labels there, so the $0.96 figure for the upper trendline is an approximate reading from the chart scale.
Trading volume, supply figures and liquidation data were not part of this review, and the chart carried no moving averages. The scenarios describe possible paths and carry no assigned probabilities.
Expert Opinion
The report from BSCN Newswire shows that tokenized real-world assets are being built on Sui. As general market commentary, one deployment does not prove demand, and the post gave no data on supply or usage.
Traders usually wait for activity figures before treating such news as a price driver. In the short term, the $0.8987 level will show whether buyers give the news weight.
Disclaimer: This article is for information only and is not financial advice. SUI is volatile, and price can fall below $0.7544 if the support breaks and broader market conditions weaken. No scenario here carries a stated probability, and a confirmed breakout can still reverse. Readers should do their own research and size any position to a loss they can accept.


















