Bitcoin BTC Could Hit $84K or $74K Next: MOONvember Meets US Midterms


Bitcoin is trading near $78,489 on Monday, November 2, as traders wait for the US midterm elections on November 3. The mood is jumpy after a rough week.
Over $3 trillion was wiped out from global markets on Friday. October also killed "Uptober," so many traders now hope November can fix things.
Prediction markets give Democrats about a 70% chance of winning both the House and the Senate.
Midterms 2026: 3 Big Risks That Could Shake BTC
The vote is about more than who runs Congress. Markets are watching three things.
AI stocks: Democrats recently introduced a proposal against government bailouts for AI firms if the AI bubble bursts. AI stocks are already in a heavy selloff.
Crypto law: Every Senate Democrat voted against advancing the CLARITY Act in September. A Democratic Congress could make crypto talks harder.
Iran war: The US has reportedly warned Middle Eastern allies to prepare for possible new strikes after November 3. That could lift oil prices and inflation again.
Midterms Have Hit BTC Hard Four Times in a Row
Ali Charts shared a pattern that traders are passing around. After the 2010, 2014, 2018, and 2022 midterms, BTC fell 72%, 65%, 52%, and 27%.
He also noted this does not prove elections caused the drops. It is only a pattern worth watching.
Midterm Year | BTC Drop After Election | Q4 Result |
2010 | -72% | +391% |
2014 | -65% | -16.70% |
2018 | -52% | -42.16% |
2022 | -27% | -14.75% |
Bitcoin gained 391% in Q4 2010, but the last three midterm years all ended Q4 in the red.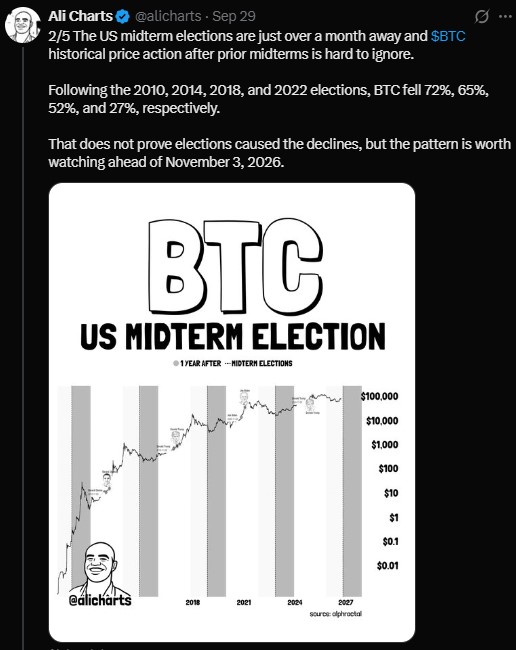
MOONvember to the Rescue? What the Monthly Data Says
Crypto Rover shared a monthly returns table after October failed to deliver. October 2026 is down about 7%, while November has started up about 1%.
Over the full history, November averages roughly +35% and a median near +18%. It finished green in about 63% of years.
The average is pulled up by huge early-year rallies, so the median is the fairer number.
Post-midterm Novembers tell a mixed story:
November | BTC Monthly Return |
2014 | about +11.7% |
2018 | about -36.6% |
2022 | about -16.2% |
So MOONvember is a hope, not a rule.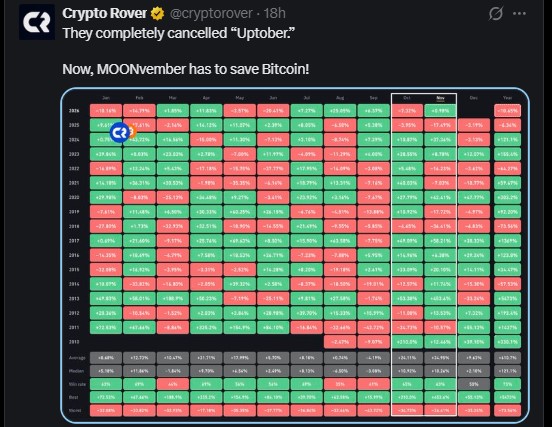
Saylor Teases More Orange: Will Strategy Buy Below $80K?
Michael Saylor posted "We found room for even more orange" on X, which many read as a hint at a new purchase. Strategy did not buy last week, and some traders think it is waiting to add below $80,000. An update could come as early as today.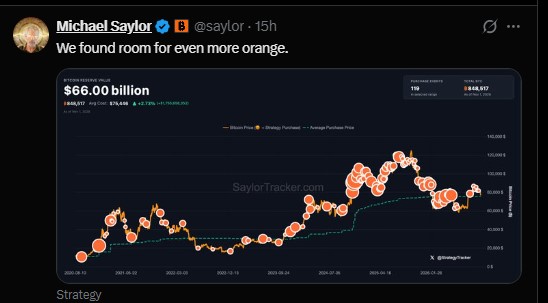
Strategy holds 848,517 BTC across 119 purchase events. The stack is worth about $66 billion.
Its average cost is $75,446, roughly $3,000 below the current price.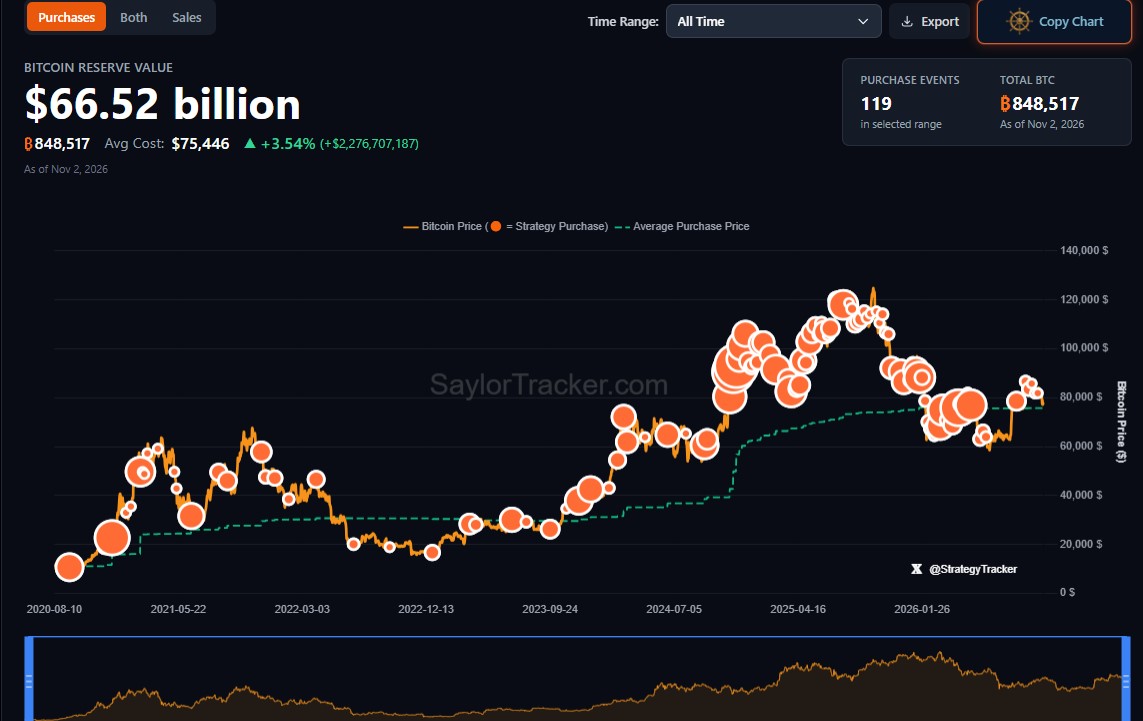
Shorts Get Squeezed as BTC Derivatives Heat Up
BTC derivatives data looks mixed but slightly upbeat. Futures volume jumped 40.31% to $34.96 billion, and open interest rose 1.11% to $53.44 billion.
Options open interest sits at $29.53 billion. The overall long/short ratio is 0.9759, while Binance and OKX account ratios are above 2.16, so many traders lean long.
In the past 24 hours, short liquidations hit $33.79 million against $6.70 million for longs. Rising open interest also means sharp moves can come fast.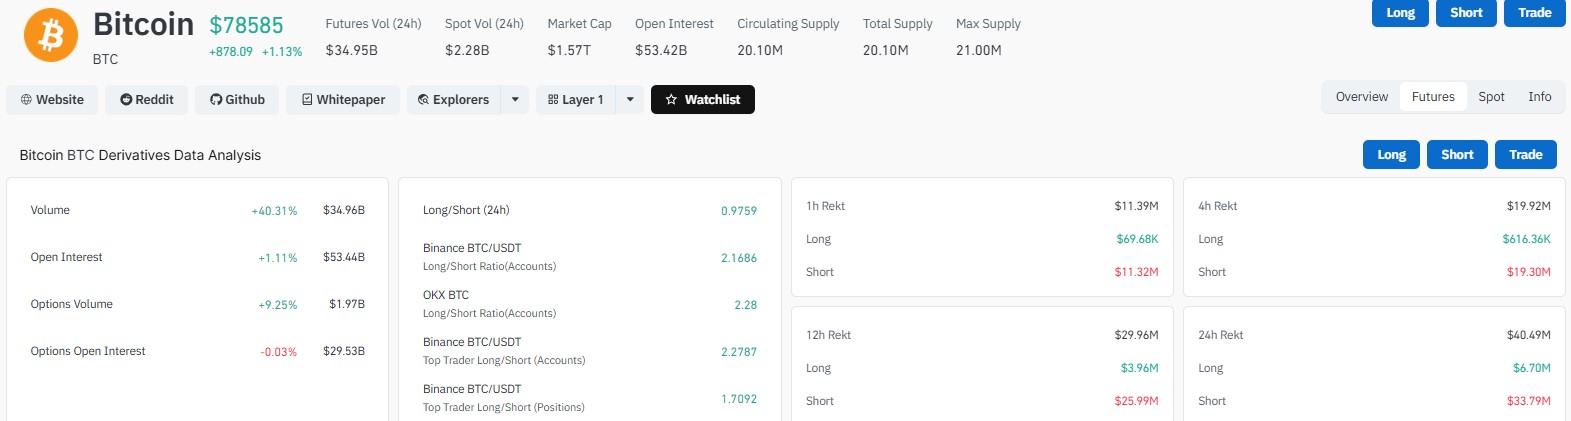
BTC Technical Outlook: $77,700 Is the Line in the Sand
On the daily chart, BTC moves inside a descending channel. Price bounced from the 200 EMA at $76,464 and now sits just above the 100 EMA at $77,770.
The RSI is near 40.84, which shows weak momentum. The 20- and 50-day EMAs near $80,200 act as the first hurdle.
Level | Price | What It Means |
Resistance 3 | $86,000 | Open if the channel breaks |
Resistance 2 | $82,000 to $84,000 | Next target after $80,200 |
Resistance 1 | $80,200 | 20- and 50-day EMAs |
Current Price | $78,489 | Near channel lower edge |
Support 1 | $77,700 to $78,000 | Buyers must defend this zone |
Support 2 | $76,464 | 200 EMA |
Support 3 | $76,000 and $74,000 | Next stops if the 200 EMA fails |
Key Zone | $73,000 | Short-term holder cost basis |
If buyers hold $77,700 to $78,000 and push above $80,200, BTC could move toward $82,000 to $84,000. A channel breakout may open $86,000.
If the 200 EMA fails, selling could pull BTC toward $76,000 and $74,000.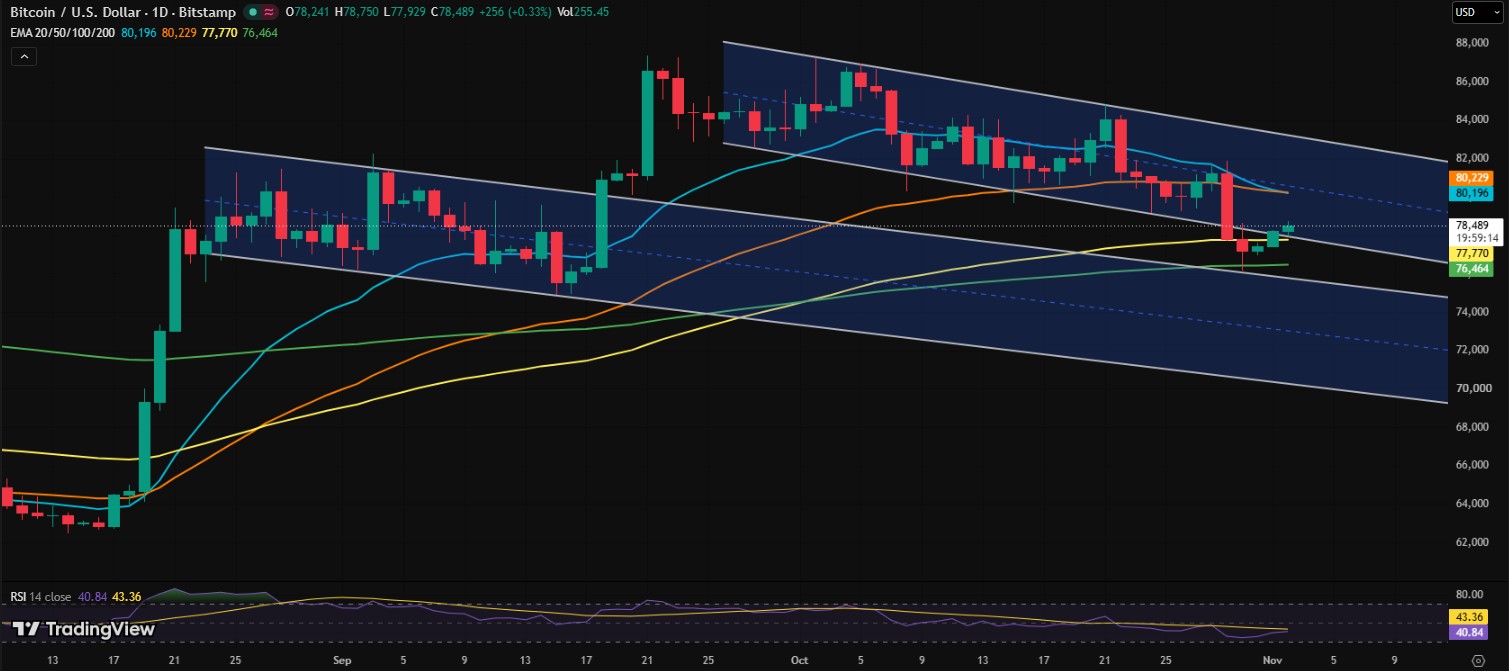
Jobs, Earnings, Iran: The Week That Could Move Markets
Ali Charts points to $73,000 as a possible buy zone if a post-election dip comes. He says this level has often held in confirmed bull markets.
That is one view, not a sure thing. Apple earnings are a worry too, since stocks fell after Google and Intel reported.
Day | Key Events |
Monday | ISM Manufacturing PMI, Apple earnings, Fed's Goolsbee speech |
Tuesday | US midterms, JOLTS, factory orders, AMD earnings |
Wednesday | Possible US strikes on Iran, ADP jobs, ISM Services PMI |
Thursday | Challenger layoffs, jobless claims, productivity |
Friday | Nonfarm payrolls, unemployment rate, wage growth, consumer sentiment |
What Comes Next for BTC?
The setup is simple. Hold $77,700, and the bounce can grow. Lose the 200 EMA and the $73,000 zone comes into play.
Past patterns may help, but they promise nothing. For Bitcoin, price action after the vote will matter more than any old chart.
Disclaimer
This article is for information only and is not financial, investment, or trading advice. Crypto assets are highly volatile, and you can lose some or all of your money. Past performance does not guarantee future results. Always do your own research and speak with a licensed financial advisor before making any decision.