Bitcoin Slips Below $80K Before Fed Decision: Is a Bottom Forming?


Bitcoin price hovered near $79,791 on Tuesday, October 27, ahead of the Fed decision on October 28. BTC dipped to about $79,300 earlier, then steadied near $80,000, after a weekend low of $79,250.
Traders are watching one question: can Bitcoin climb back above $80,000? CME FedWatch gives a hold 89.5% odds, with a 10.5% chance of a hike.
The data is split. ETFs took in $110.34 million on October 26, and retail inflows hit a 6-month high. But small wallets keep leaving, Bitcoin sits below the daily WMA 50 near $80,960, and Q4 has been red in the last three midterm years.
Will BTC reclaim $80K before the Fed speaks? Here are the numbers, levels, and events to watch.
Why Is Bitcoin Down Today?
Bitcoin has fallen for five days in a row on the daily chart. It also slipped below the daily WMA 50 near $80,960.
Altcoins are mixed. Ether sits at $2,310, up 0.21%. XRP is up 1.35% at $1.28.
The market cap is about $1.60 trillion. Futures volume over 24 hours is $48.30 billion.
What Does the Fed Decision on October 28 Mean for Bitcoin?
The current target rate is 3.75% to 4.00%. CME FedWatch shows the chance of a cut at 0%.
Time | No Change (3.75%-4.00%) | Hike (4.00%-4.25%) |
Now | 89.5% | 10.5% |
1 day ago | 90.0% | 10.0% |
1 week ago | 81.2% | 18.8% |
1 month ago | 35.8% | 64.2% |
A month ago, a hike looked more likely than a pause. Now most traders expect no change. A 10.5% hike chance still remains, so a surprise could shake the market.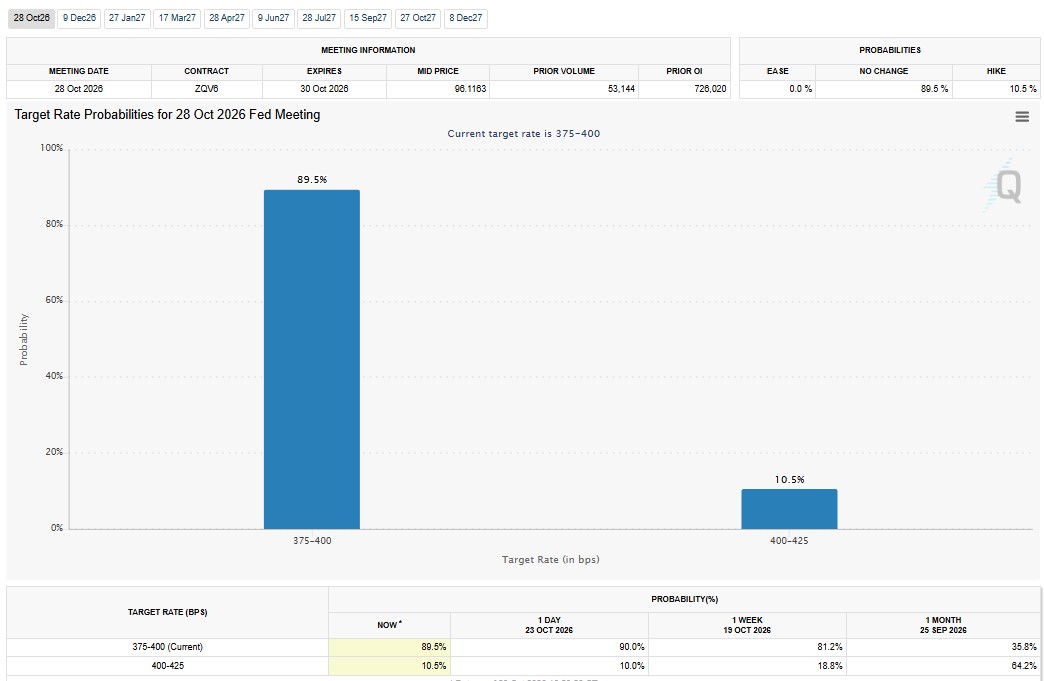
Are Bitcoin ETFs Still Seeing Inflows?
Yes, but only one fund added money on October 26.
Metric | Value |
Daily net inflow | $110.34 million |
Cumulative net inflow | $57.29 billion |
Total net assets | $102.84 billion (6.41% of market cap) |
IBIT net assets | $64.80 billion |
FBTC net assets | $14.05 billion |
GBTC cumulative flow | -$28.00 billion |
All of the daily inflow came from BlackRock's IBIT. The other ten funds on the list showed $0.00. Most ETF share prices fell between 1.52% and 1.68% that day.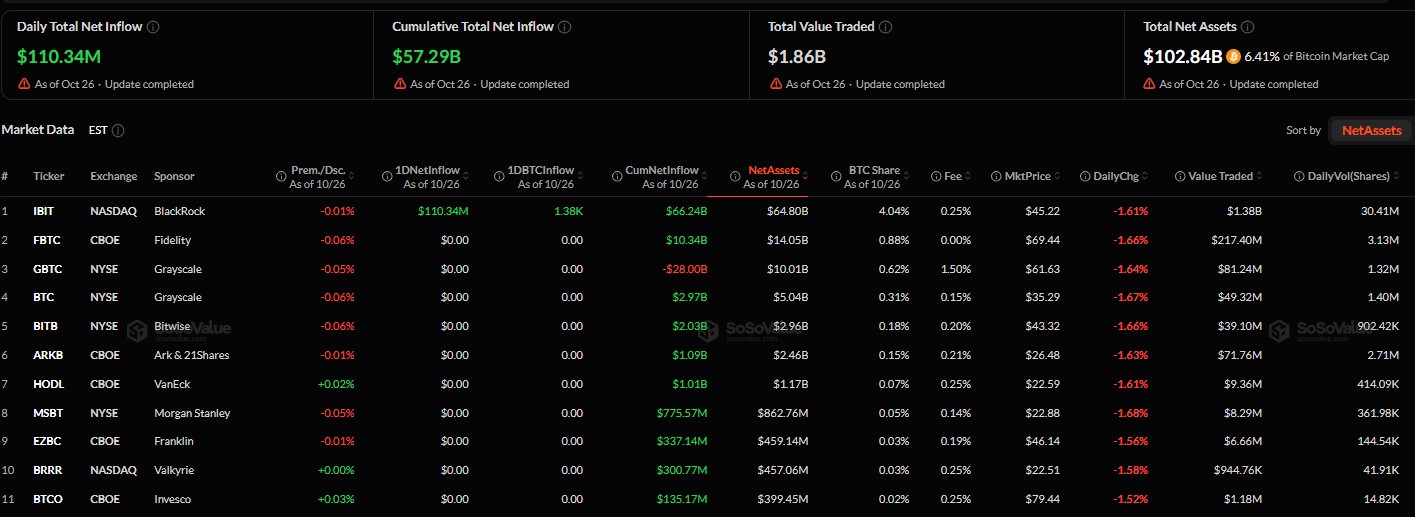
What Do BTC Open Interest and Liquidations Show?
Metric | Value |
Open interest | $54.29 billion (+1.41%) |
Options volume | $3.51 billion (+55.95%) |
Long/short ratio (24h) | 1.0255 |
Binance accounts ratio | 2.3501 |
Top traders (accounts/positions) | 2.4807 / 1.9472 |
24h liquidations | $36.66 million |
Longs lost $18.68 million, and shorts lost $17.98 million. That is a fairly even split.
A ratio above 1 means more long positions. High open interest and leverage can still bring sharp swings.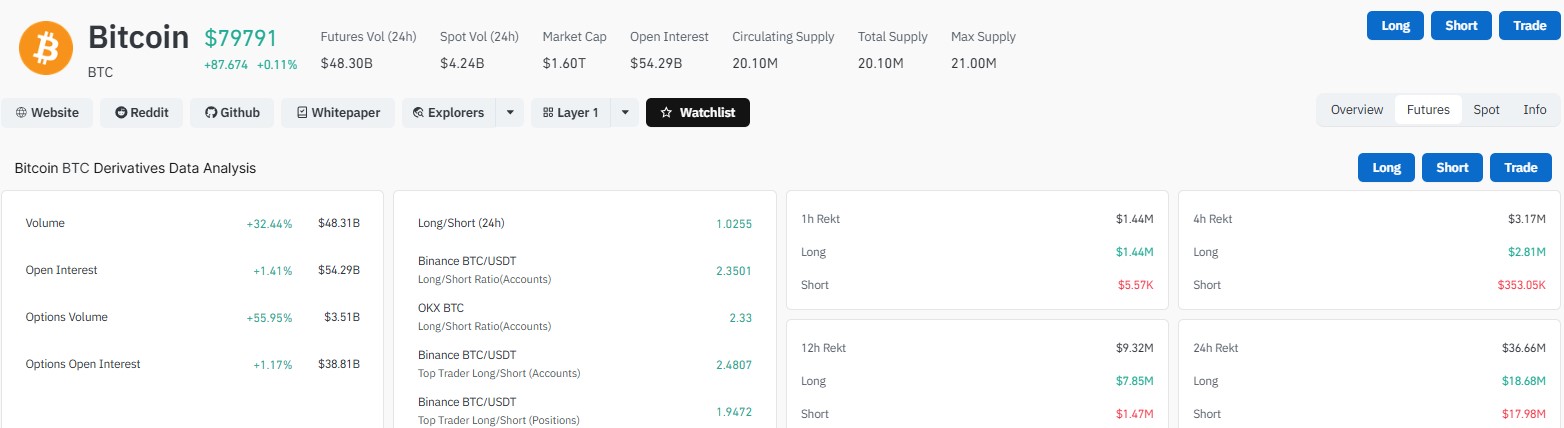
Has Bitcoin Hit a Bottom? What Wallet Data Says
Santiment says BTC lost roughly 30,000 non-empty wallets since October 16. The total is now near 59.95 million.
That may sound bad, but smaller holders seem to be losing patience after weeks of flat price action. A past drop of 290,000 holders came before the August rise, according to the Santiment chart.
Retail inflows also hit a 6-month high while $BTC holds $80K. Whales and retail are acting in opposite ways.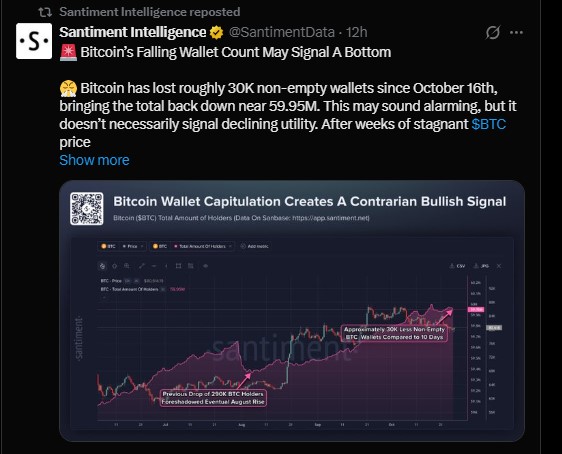
What Are the Key BTC Support and Resistance Levels Today?
Level | What It Means |
$87,500 | Resistance |
$84,800 | Resistance |
$82,500 | Reclaim level for the wallet-count bottom case |
$82,000 | Resistance on the 4-hour chart |
$80,960 | Daily WMA 50 |
$80,000 | Immediate battleground |
$75,000 | Support |
$72,500 | Possible correction target |
Ali Charts says BTC broke below a rising parallel channel on the 4-hour chart. If $82,000 keeps capping price, a drop toward $72,500 is possible. That is where the analyst plans to look for a buy.
A move above $85,000 would be a better sign. A clean break below $79,000 would delay any bottom setup. These are views from analysts, not sure paths.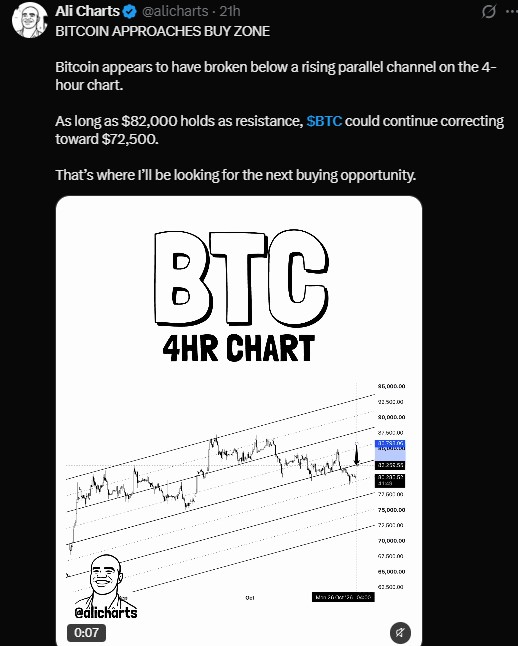
Does BTC Fall in Q4 of Midterm Election Years?
In the last three midterm years, Q4 ended in the red, based on Coinglass data shared by Ali Charts.
Year | Q4 Result |
2014 | -16.70% |
2018 | -42.16% |
2022 | -14.75% |
Three data points are a small sample. The pattern may not repeat in 2026.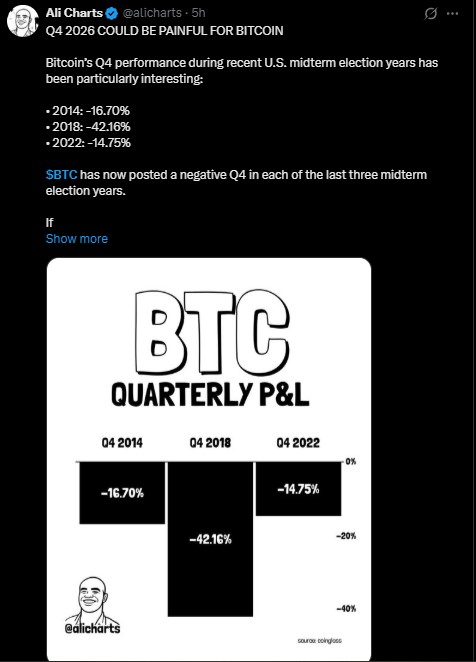
Can BTC Reach $200K?
Analyst Javon Marks points to a macro ascending channel that has held since 2016. He says each test of the midline was followed by a run to the upper level.
In his view, that leaves some chance of a move above $200K and toward $500K+. There is no timeline, and nothing is guaranteed.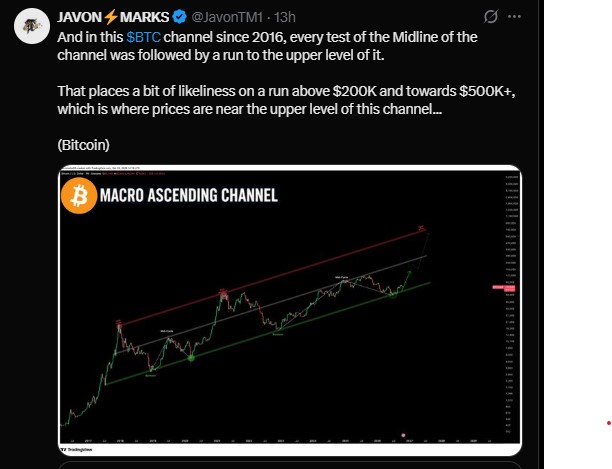
What Could Move BTC This Week?
Several big events land at once: the Israel election, the FOMC decision, big tech earnings, U.S. PCE, GDP, and the midterm elections.
If BTC gets back above the daily WMA 50, the chart looks better. If not, $75,000 comes into focus.
Disclaimer
This article is for information only and is not financial, investment, or trading advice. Crypto is highly volatile, and you can lose some or all of your money. Prices, ratios, and flows change fast. Do your own research and speak with a licensed financial advisor before you invest.



















