Zcash Price Prediction November 2026: Is ZEC Ready for a Comeback?


Trader calls 1,200 a solid zone for ZEC and expects it to pay off if bullish momentum continues. Does the chart back that view? Partly. The zone holds the $1,099.17 support and the 100 EMA, and the price sits just above it.
But it is an opinion, and the price is stuck near its 20 EMA. This Zcash Price Prediction November 2026 checks the call, a Grayscale post and the liquidation data against the daily chart.
Market data checked on October 27, 2026, at 09:38 IST.
Zcash Prediction Today: Market Overview
Metric | Value |
Price (TradingView Binance daily chart) | $1,222.11 |
Daily Candle Change | +2% |
Candle Open | $1,233.34 |
Candle Range | $1,217.00 – $1,242.59 |
Zcash News Today: Grayscale Points to the Dev Fund and Ironwood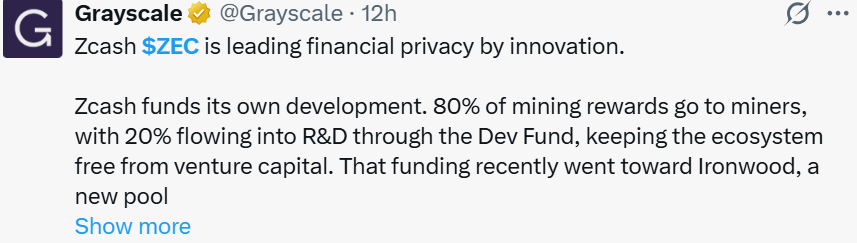
Grayscale posted that Zcash funds its own development. It says 80% of mining rewards go to miners and 20% goes to research and development through the Dev Fund, which keeps the network free from venture capital.
The post adds that this funding recently went toward Ironwood, a new pool with advanced privacy features.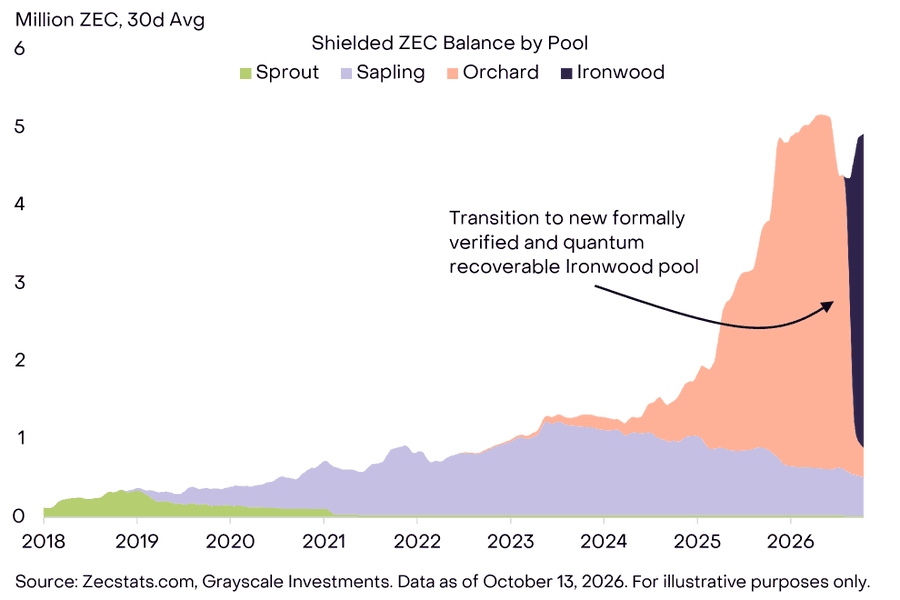
CoinGabbar could not verify the split or the Ironwood details.
Zcash News: 1,200 Solid Zone For Buyers
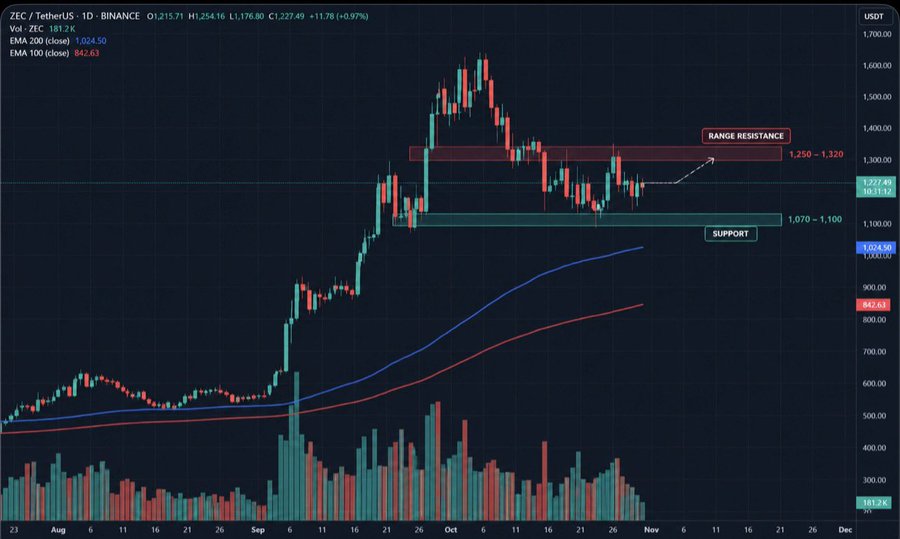
The 1,000–1,200 still looks like a solid area and the zone could pay off if bullish momentum continues. On the chart, the $1,099.17 support line and the 100 EMA at $1,036.40 both sit inside that zone.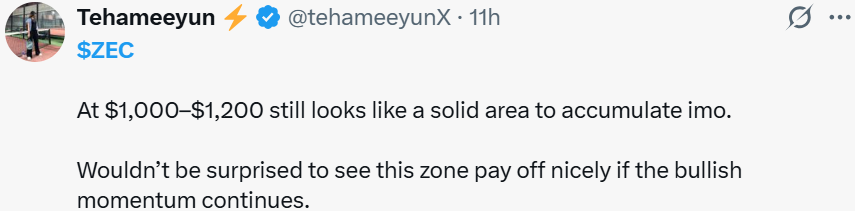
Source: Data From X
ZEC Price Outlook: ZEC Liquidation and Futures Volume
A liquidation happens when an exchange force-closes a leveraged trade because the trader can no longer cover losses. Longs bet on a rise, and shorts bet on a fall.
Window | Total Liquidated | Long | Short |
12h | $956.91K | $606.65K | $350.26K |
24h | $4.44M | $1.26M | $3.19M |
Source: Data From CoinGlass
Shorts took about 72% of the $4.44M liquidated over 24 hours. Shorts lose when price rises, which fits the recent bounce.
Coinglass futures volume leads with Binance at $1.71B, MEXC at $1.48B, OKX at $1.05B, Bybit at $344.33M and LBank at $305.45M. The screenshot gives no time window.
Zcash Price Prediction: Chart Analysis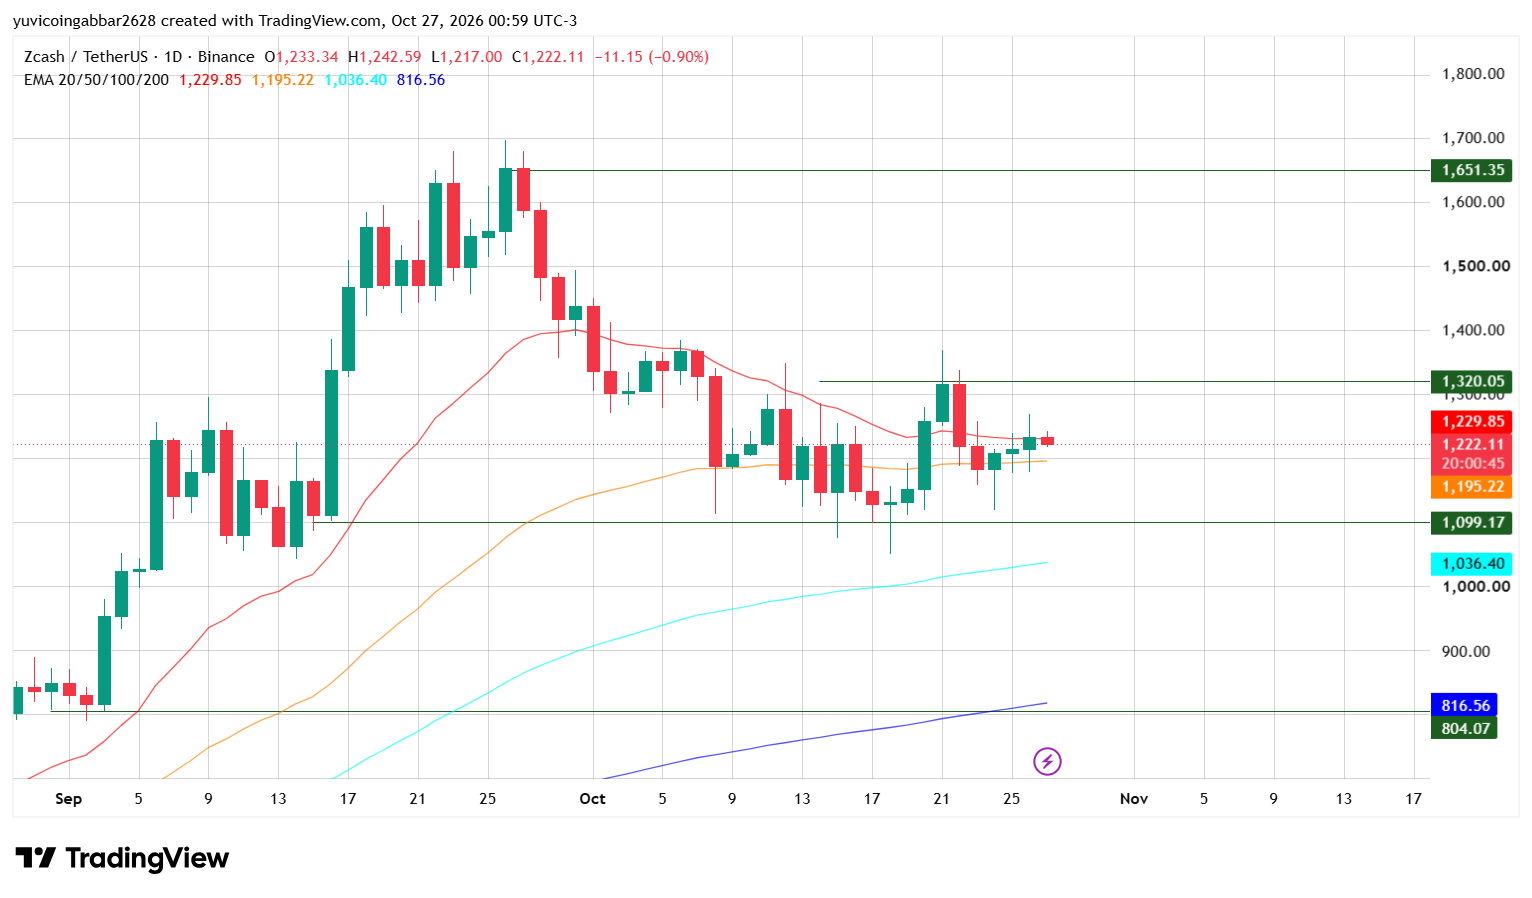
ZEC fell from a peak near $1,700 in late September and has moved sideways since early October. Today's candle opened at $1,233.34, ranged from $1,217.00 to $1,242.59 and printed $1,222.11, just under the 20 EMA.
An EMA is a trend line that weights recent prices more heavily. Price sits about 0.6% below the 20 EMA and 2.2% above the 50 EMA, so it is squeezed between the two.
Price is building a base and absorbing liquidity ahead of a further move up. This is a pattern, not a sign that Zcash is weak. A breakout in either direction from the range could trigger a rally, with resistance at $1,320 and support at $1,099. Keep an eye on ZEC.
EMA | Value | Position vs Price |
EMA 20 (red) | $1,229.85 | Above price |
EMA 50 (orange) | $1,195.22 | Below price |
EMA 100 (cyan) | $1,036.40 | Below price |
EMA 200 (blue) | $816.56 | Below price |
Zcash Forecast: Support and Resistance Levels
Type | Level |
Resistance 2 | $1,651.35 |
Resistance 1 | $1,320.05 |
Immediate support | $1,099.17 |
Deeper support | $804.07 |
Bull case: A daily close above the EMA 20 at $1,229.85 would put $1,320.05 in view, about 8% higher. A close over that would open $1,651.35.
Bear case: If $ZEC closes below the EMA 50 at $1,195.22, price could slide toward $1,099.17. A close under that would put the 100 EMA at $1,036.40 in play.
ZEC Scenarios and Invalidation (October 27, 2026)
Scenario | Trigger | Likely Outcome | Invalidation |
Bull | Close above $1,320.05 | Move toward $1,651.35 | Close below $1,099.17 |
Base | Range of $1,099.17 to $1,320.05 | Sideways near the 20 and 50 EMAs | Break of either level |
Bear | Close below $1,099.17 | Slide toward $1,036.40, then $804.07 | Close back above $1,099.17 |
Zcash Price Prediction November 2026: Can Zcash Reach $1,651.35?
It would take a gain of about 35% from $1,222.11. Any ZEC price prediction toward that level needs more than a funding post, since ZEC must clear the EMA 20 and $1,320.05 first.
Zcash Price Prediction: Expert View
Momentum is flat, with price pinned between the 20 and 50 EMAs, so the first daily close outside $1,195.22 to $1,229.85 will set the tone
Disclaimer
This article is for informational purposes only and isn't financial advice. Crypto markets are volatile. Always do your own research before making any trading decisions involving ZEC.



















