Crude Oil Price Prediction: Hormuz Claim and WTI Rally: Is $94 Next?


A report of heavier oil shipments through the Strait of Hormuz would usually calm supply fears. Yet WTI crude oil is higher today.
This crude oil price prediction starts with that contrast, since the benchmark has gained 2.83% on the day.
Crude oil is one of the most traded commodities in the world. West Texas Intermediate, known as WTI, is the main US benchmark and is quoted in dollars per barrel.
The crude oil price today is $91.45 per barrel, up 2.83%, a gain of $2.52 on the day.
The hourly chart shows that the rise has carried the price toward a key ceiling. Anyone searching for a crude oil price prediction 2026 outlook will want to know whether that ceiling gives way or holds.
WTI Crude Oil Live Market Data
Metric | Value |
Price | $91.45 per barrel |
Day Change | +$2.52 (+2.83%) |
Hourly Open | $91.663 |
Hourly High | $91.719 |
Hourly Low | $91.217 |
RSI (1H) | 70.01 |
Source: TradingView, CFDs on WTI Crude Oil, October 8, 2026, 13:42 IST.
Crude Oil News Today
The latest crude oil news comes from a social media post. It says President Trump stated that more oil passed through the Strait of Hormuz in the last three nights than before. 
Source: Data Taken From the @Technopolitik_X Account
The Strait of Hormuz is a major passage for global oil shipments. The post gives no shipping figures, and we could not verify the claim independently.
More oil in transit would normally ease supply concerns, yet WTI rose today. We cannot say what drove the move.
WTI Crude Oil Technical Analysis
The hourly chart shows WTI inside an ascending channel that began on the evening of October 6 from a low just below 87.
The price now tests the upper boundary of the channel. That boundary sits close to resistance at 92.003.
The current 1H candle is due to close at 14:30 IST, so the reading can still change. The chart price of 91.427 on FXCM also differs slightly from the TradingView snapshot price of 91.45.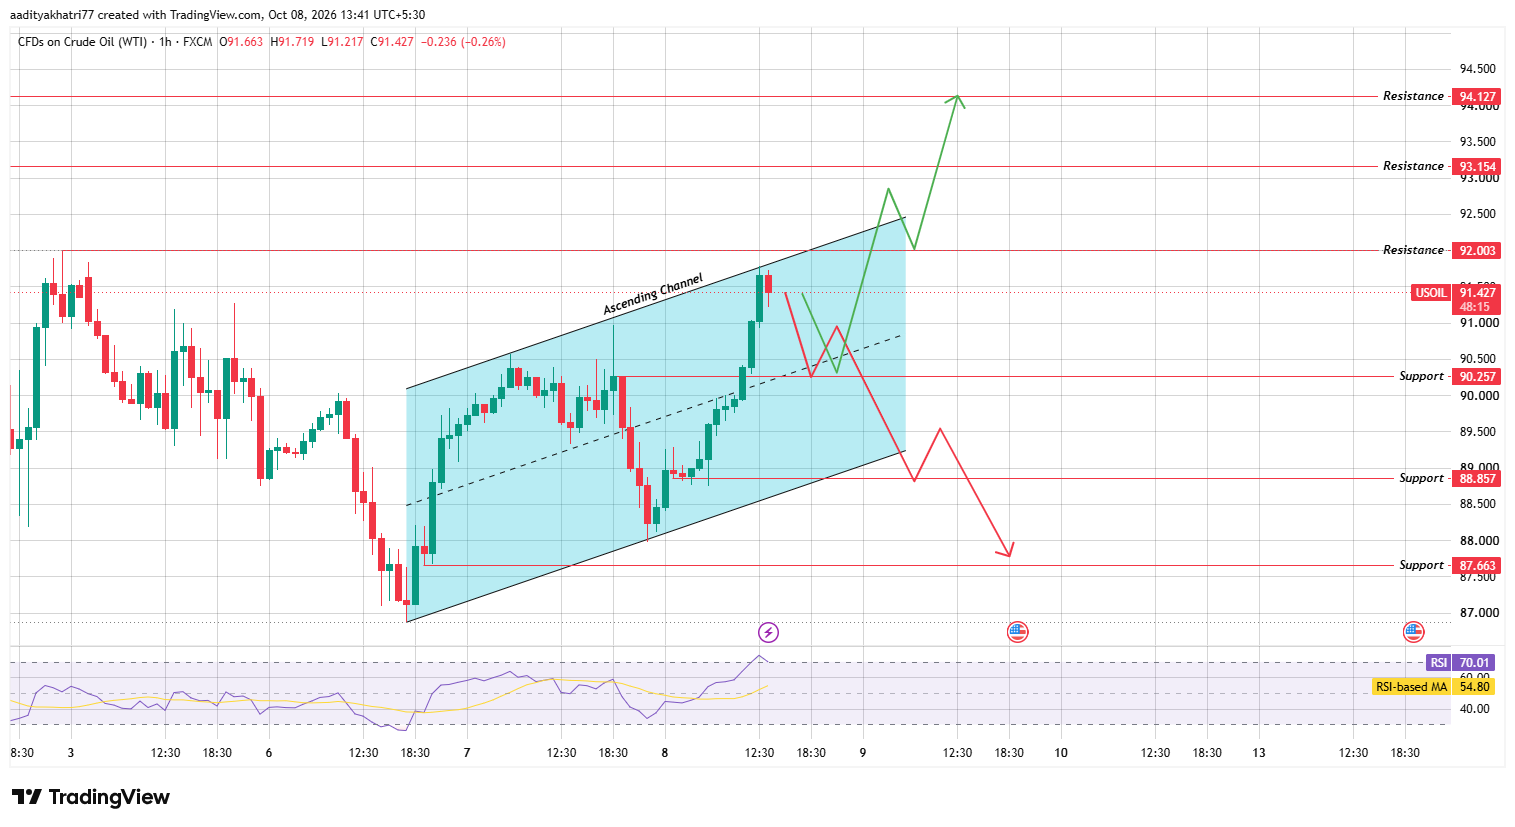
Source: TradingView, CFDs on Crude Oil (WTI) 1H chart, FXCM, October 8, 2026
The RSI stands at 70.01, far above its moving average of 54.80. That marks an overbought reading after a sharp climb.
Such readings can come before a pause or pullback, although strong trends can stay stretched. Our crude oil technical analysis therefore waits for price and volume to confirm the next move.
Crude Oil Price Prediction: Can WTI Bounce From Support and Break Higher?
The bullish case begins with a pullback to the support at 90.257, about 1.3% below the 91.427 chart price. A bounce from there on volume above the 20-candle average would show that buyers are defending the channel.
The next test is resistance at 92.003, about 0.6% above the chart price. A 1H close above that level and above the upper channel boundary, on rising volume, would confirm a breakout.
From there, the chart points to 93.154, roughly 1.9% higher. A further advance would target 94.127, about 3.0% above the chart price. A move above the boundary on thin volume often fails, so volume matters at each step.
What Happens to WTI If Support Breaks?
The bearish case begins with a 1H close below 90.257, together with rising sell volume. That would show that the pullback is turning into a decline.
The next support then sits at 88.857, about 2.8% below the chart price, close to the lower boundary of the channel.
A close below that boundary would point to 87.663, roughly 4.1% lower. That level marks the base of the move that began on October 6.
The overbought RSI adds weight to this scenario. A fall of the RSI toward its moving average of 54.80 would show that momentum is cooling.
Price Levels to Watch
These levels come from the hourly chart and are judged on closing prices.
Support | Resistance |
90.257 | 92.003 |
88.857 | 93.154 |
87.663 | 94.127 |
Bull, Base, and Bear Scenarios
Scenario | Setup | Level |
Bull | Bounce from support, then 1H close above resistance and the upper boundary on above-average volume | 92.003 to 94.127 |
Base | Price moves between support and the upper boundary of the channel. | 90.257 to 92.003 |
Bear | 1H close below support, then below the lower boundary, on rising sell volume | 88.857 to 87.663 |
Crude Oil and Supply Headlines
Oil prices often react to news about shipping routes, production, and stockpiles.
A headline about the Strait of Hormuz can therefore matter even when it comes without data. Traders usually wait for tanker figures or official reports before they adjust their view.
We have no inventory, production, or tanker data for this update, so we make no claim about their current direction. Readers following the crude oil price forecast should treat headlines as context and let the closing prices guide them.
Methodology
This crude oil price prediction uses three inputs. The levels, the ascending channel, and the RSI come from the 1H FXCM chart on TradingView, captured at 13:41 IST on October 8, 2026.
The price snapshot comes from TradingView's USOIL quote at 13:42 IST. The news item comes from a public social media post.
We use the chart price of 91.427 for percentage distances and the snapshot price of 91.45 for the headline figure.
We accept a breakout or breakdown only on a closed 1H candle, with volume above the 20-candle average. That average is our own confirmation standard and does not come from the chart.
Expert Opinion
General market commentary on overbought readings holds that a high RSI shows a stretched move, not a certain reversal. After a gain of nearly 3% in a day, prices often pause before the next leg.
Applied to WTI, that view favors patience. A bounce from 90.257 on strong volume would keep the channel intact. A close below it would suggest that the recent gain is fading.
Disclaimer: This article is for information only and is not financial advice. Oil prices are volatile and can fall below every support level listed here. Trading CFDs and other leveraged products can lead to losses larger than the amount invested. Technical levels can fail, and no scenario above has a guaranteed probability. Please research independently and invest only what you can afford to lose.












.webp)




