Dogecoin Price Prediction: Why DOGE Is Stuck Below $0.09657 Today?


The Dogecoin price prediction debate has turned more constructive this week. Spot ETF inflows are picking up, and large wallets are reportedly buying.
Even so, DOGE still trades about 87% below its 2021 all-time high.
Dogecoin (DOGE) launched in December 2013 as a lighthearted token built on Litecoin's code, with the Shiba Inu meme as its mascot.
The Dogecoin price today is $0.09561, up 2.4% in 24 hours. The dogecoin ranks 12th by market value, with a market cap of $14.928 billion and a 24-hour trading volume of $1.037 billion.
Live DOGE Market Data
Metric | Value |
Price | $0.09561 |
24h Change | +2.4% |
24h Range | $0.0929 to $0.09794 |
Market Cap | $14.928B |
Source: market data taken from CoinGecko, as of Oct 1, 2026. Figures may vary slightly across other tracking websites.
Daily volume equals roughly 7% of market cap, which is an active level of turnover for a coin of this size.
Perpetual futures open interest of $2.222 billion also means leveraged positions can amplify a move in either direction.
Dogecoin News Today: ETF Inflows and Whale Buying
According to BSCN, the three spot Dogecoin ETFs are heading for their second-best month on record.
Net inflows have reached $3.71 million in September. Only January 2026 did better, with $4.07 million.
Source: Data taken from @BSCNews, X Account, as of Oct 1, 2026
The sum is small next to a $14.9 billion market cap, yet it shows investors are still using regulated products to gain DOGE exposure.
BSCN also asked whether memecoin season is returning, which remains a question and not a confirmed trend.
$DOGE Whale Buying
A separate post reported that Dogecoin whales bought more than 1.14 billion DOGE over the past four days. 
Source: Data taken from @Investments_CEO, X Account, as of Oct 1, 2026
At the current price, that is roughly $109 million. The post calls it major accumulation.
We have not verified the figure against on-chain records, so readers should check it with a wallet tracker before treating it as confirmed.
Dogecoin Technical Analysis: 4H Symmetrical Triangle
On the 4-hour chart, DOGE is moving inside a symmetrical triangle. A falling trendline from the late September high caps each rally, while a rising trendline from the September 23 low holds each dip. 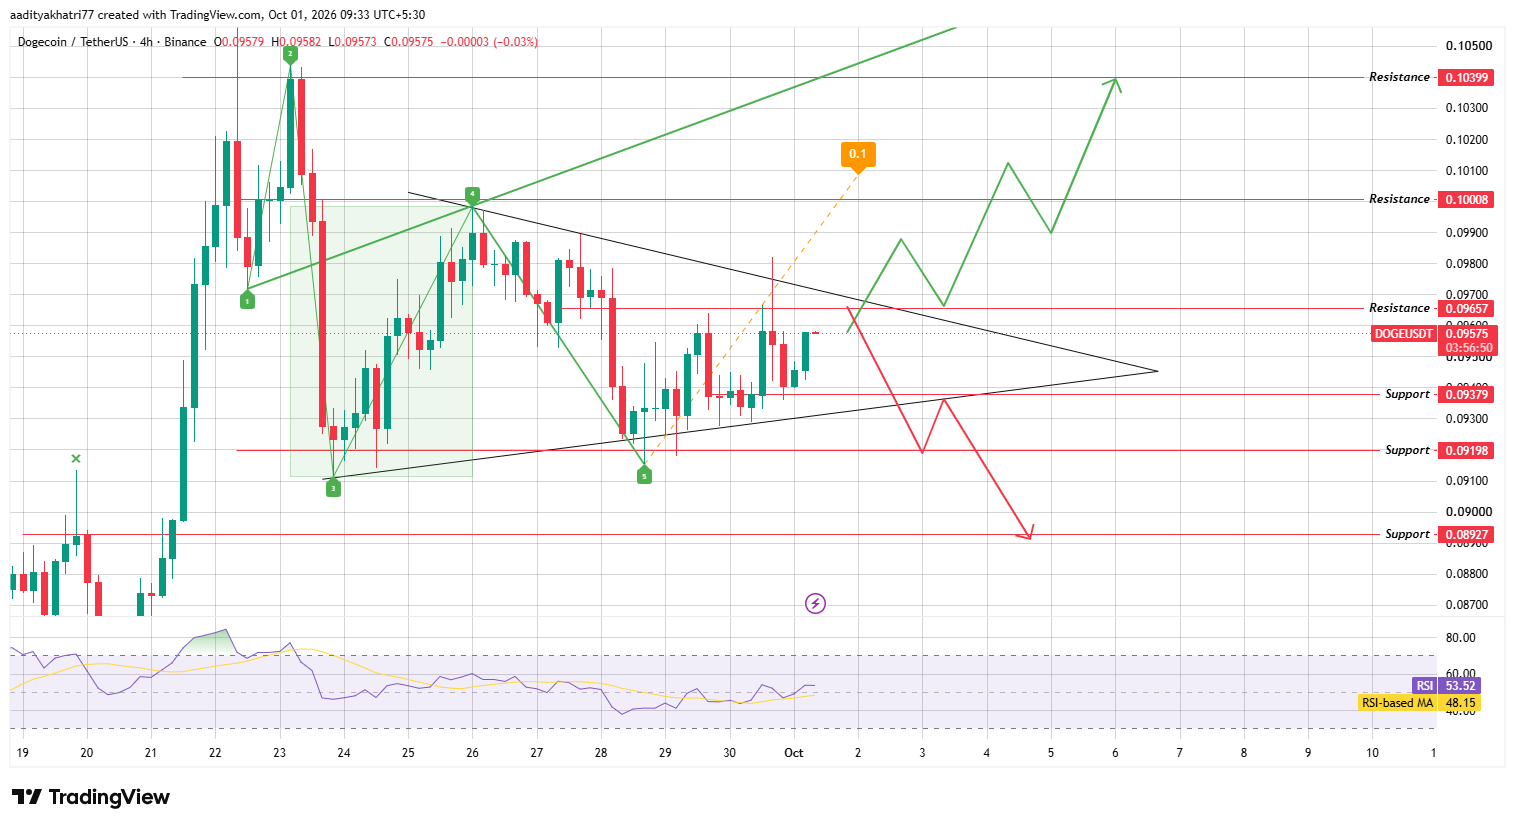
Source: Chart taken from TradingView, Binance DOGEUSDT 4H chart, captured at 9:33 AM IST (UTC+5:30), October 1, 2026
The two lines converge toward an apex in the first week of October, so a decisive move is likely soon.
The chart price is $0.09575, between the nearest resistance at 0.09657 and the nearest support at 0.09379. It differs slightly from the CoinGecko figure because one is a single-exchange quote and the other is a market-wide average.
The current 4H candle closes at 1:30 PM IST (08:00 UTC), and every level here refers to 4H closing prices.
RSI reads 53.52 and sits above its moving average of 48.15. That points to modest improvement in momentum without an overbought signal.
The Wolfe wave drawn on the chart adds a bullish lean. The five-point pattern projects toward $0.10, close to the resistance at 0.10008.
It is a projection and not a promise, and it loses weight if the price falls through the rising trendline. This Dogecoin price prediction October 2026 therefore depends on which trendline breaks first.
Dogecoin Price Prediction: Can DOGE Break Above $0.09657?
Buyers need a 4H candle close above $0.09657, backed by volume higher than the average of the previous 20 candles.
That level sits next to the falling trendline of the triangle, so a clean close above both would remove the main cap on price.
The first target would then be $0.10008, about 4.5% above the chart price. A later push through it would open 0.10399, roughly 8.6% higher.
The chart does not show a straight climb. It expects pullbacks toward the broken resistance after each leg, which is normal behavior after a breakout.
The Wolfe wave target near $0.10 and the ETF and whale headlines all fit this scenario, though none of them guarantees it.
What Happens If Dogecoin Gets Rejected at $0.09657?
If sellers defend 0.09657 again, DOGE would likely slide back toward the lower end of the triangle.
The level at $0.09379 combines horizontal support with the rising trendline, which makes it the most important floor on the chart.
A 4H close below it would break the triangle to the downside and expose 0.09198. The chart then shows a possible retest of the broken trendline from below.
After that, it points to a further decline toward $0.08927, about 6.8% under the chart price.
A drop of that kind would also work against the Wolfe wave projection, since the pattern points the other way.
Price Levels to Watch
Support | Resistance |
$0.09379 | $0.09657 |
$0.09198 | $0.10008 |
$0.08927 | $0.10399 |
Bull, Base, and Bear Scenarios
Scenario | Setup | Level |
Bull | 4H close above $0.09657 with above-average volume, then a close above the falling trendline | $0.10008, then $0.10399 |
Base | Price stays inside the triangle while the trendlines keep converging. | $0.09379 to $0.09657 |
Bear | Rejection at $0.09657, then a 4H close below $0.09379 | $0.09198, then $0.08927 |
DOGE vs Bitcoin
Over the past 24 hours DOGE gained 2.4% against the US dollar and 2.0% against Bitcoin, based on CoinGecko data.
The gap suggests Bitcoin itself moved only slightly. Dogecoin has tended to follow Bitcoin's direction with wider swings, so a sharp BTC move could decide which side of the triangle breaks first.
Anyone following this Dogecoin price prediction 2026 outlook should watch Bitcoin alongside the levels above.
Methodology
This DOGE price forecast starts with the 4-hour DOGEUSDT chart from Binance on TradingView, captured at 9:33 AM IST on October 1, 2026.
Support and resistance levels come straight from that chart, and every percentage distance is measured from its 0.09575 price. Market data comes from CoinGecko.
The ETF and whale figures come from the social media posts quoted above, and we did not check them against on-chain records. CoinGabbar's Dogecoin price prediction describes scenarios and levels. It does not claim to know which one will play out.
Expert Opinion
General market commentary this week centers on two themes: rising ETF demand and whale accumulation. Both are worth following, yet neither is large against a $14.9 billion market cap.
A $3.71 million monthly inflow is a signal of direction, not size. The whale purchase matters most if buying continues while the price tests $0.09657.
From a chart view, the triangle is close to resolving, and the first 4H close outside it is the clearest signal available.
Disclaimer: This article is for information only and is not financial advice. Dogecoin is a highly volatile asset, and a break below $0.08927 could lead to deeper losses. Chart patterns such as triangles and Wolfe waves fail often, and no probability can be assigned to any scenario here. You can lose part or all of your capital, so do your own research before making any decision.











.webp)










