Ethereum Breaks Neckline at $2,520: Can ETH Hit $2,640 This Week?


Ethereum price prediction talk is getting louder as ETH trades near $2,555. The coin gained $53.79, or 2.15%, and held above the $2,500 support zone.
Bitcoin stayed above $83,000, and XRP traded near $1.40. Fundstrat's Tom Lee has said ETH could pass $5,000 before the year ends. That is a forecast, not a promise.
This guide covers the ETH price today, key chart levels, and what traders are watching.
What Is the ETH Price Today?
ETH is trading at $2,555.75, up 2.15% on the day. Here is a quick look at the market data.
Metric | Value |
Price | $2,555.75 |
24h change | +$53.79 (+2.15%) |
Market cap | $312.20 billion |
Futures volume (24h) | $24.16 billion |
Spot volume (24h) | $1.66 billion |
Open interest | $32.14 billion |
Options volume | $1.31 billion |
Options open interest | $6.17 billion |
Circulating supply | 122.12 million ETH |
Futures volume rose 82.77% and open interest rose 1.76%. Options volume also grew 41.49%. More traders are active right now.
Why Is ETH Going Up Today? Short Liquidations Explained
Short sellers took most of the pain. Over 24 hours, short liquidations hit $38.23 million, while long liquidations were $10.14 million.
Period | Total Liquidated | Longs | Shorts |
1 hour | $1.41M | $1.10M | $308.85K |
4 hours | $7.91M | $1.57M | $6.33M |
12 hours | $21.55M | $6.50M | $15.05M |
24 hours | $48.37M | $10.14M | $38.23M |
The overall long/short ratio is 1.0492, a small edge for longs. On Binance, the account ratio is 2.7092. On OKX, it is 1.71.
Binance top traders show 1.8686 by accounts and 1.4671 by positions. Big traders look less aggressive than regular accounts. That gap is worth watching.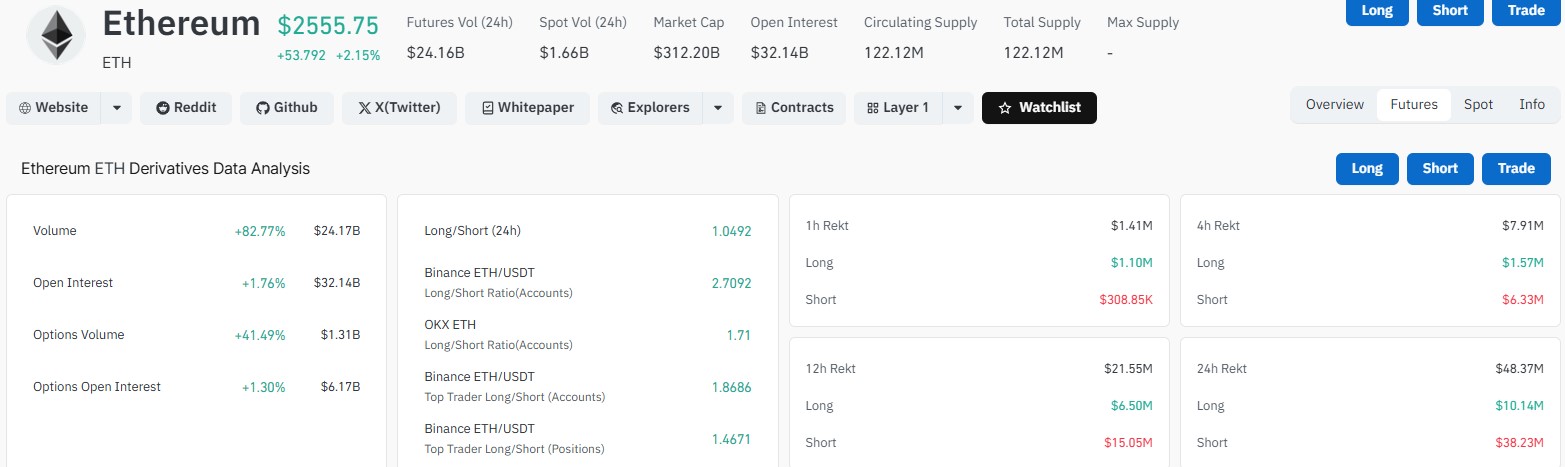
ETH Price Forecast: Is a Sunday Breakout Coming Above $2,520?
Analyst Ali Charts asked if a Sunday breakout is near. On the 10-minute chart, ETH looks to be forming an Adam and Eve bottoming pattern, with the neckline at $2,520.
ETH has moved above that line and sits near $2,555. A sustained close above $2,520 could confirm a bullish breakout. The next target is $2,640.
Ten-minute patterns are short-term. They can fail fast if the price slips back under the neckline.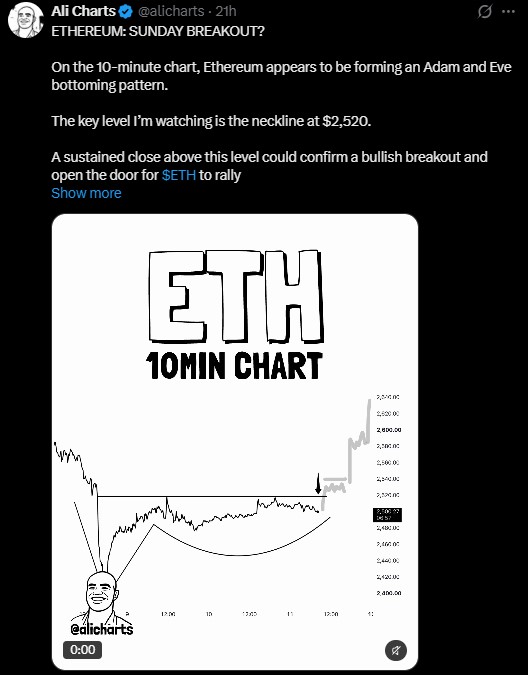
How High and How Low Can ETH Go? Key Levels to Watch
On the daily chart, ETH trades near $2,562 inside a rising parallel channel. That setup is mildly bullish.
Price pulled back from the $2,750 to $2,800 zone and is now trying to recover. The RSI is near 47, which points to neutral-to-weak momentum.
Level | What It Means |
$2,850 | Near the upper channel boundary |
$2,800 | A confirmed breakout here strengthens the upside case |
$2,750 | Recent resistance zone |
$2,640 to $2,650 | Near-term upside targets |
$2,520 | Adam and Eve neckline |
$2,450 to $2,400 | Key support area |
$2,300 | First downside target if $2,400 breaks |
$2,200 | Deeper downside level |
Is the Foundation Selling ETH? Kraken Deposits Explained
Ethereum news today is not all positive.
Lookonchain reported that two wallets linked to the Ethereum Foundation sent 4,393 ETH, worth $11.13 million, to Kraken.
Those wallets first received 59,751 ETH ten years ago, when ETH cost only $0.90. Arkham data lists several deposits of 700 to 1,395 ETH each, spread across a few Kraken deposit addresses.
Exchange deposits can mean selling, but not always. The price still rose despite the report.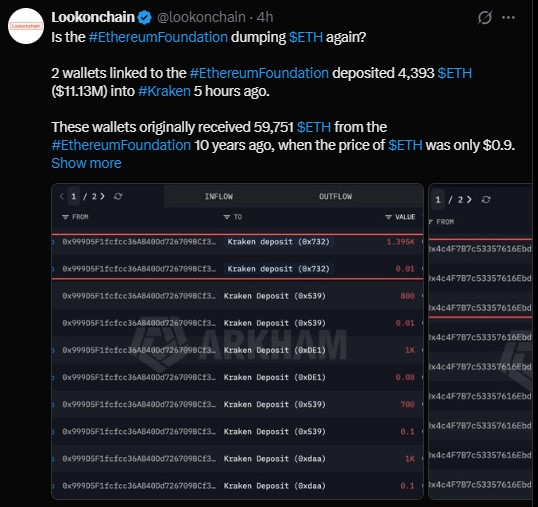
What Could Move ETH This Week? CPI, PPI and Fed Remarks
This week's calendar adds more risk. It includes ADP jobs data, consumer inflation, producer inflation, jobless claims and Federal Reserve remarks.
Those releases can shift interest rate hopes. Crypto often reacts fast to that.
ETH Price Prediction: Will ETH Go Up or Down Next?
Nobody knows where ETH goes next. These are simple paths based on the charts above.
Scenario | Trigger | Possible Levels |
Bullish | Sustained close above $2,520, support holds at $2,450 | $2,640 to $2,650, then $2,750 to $2,850 |
Neutral | Price stays inside the channel | Range of $2,450 to $2,650 |
Bearish | Break below $2,400 | $2,300, then $2,200 |
The Ethereum price forecast looks cautiously bullish while the lower channel support holds. A confirmed move above $2,800 would make the case stronger.
Still, the RSI is only 47. Buyers have not taken full control yet. Any ETH price prediction should leave room for surprises, especially with big macro data coming.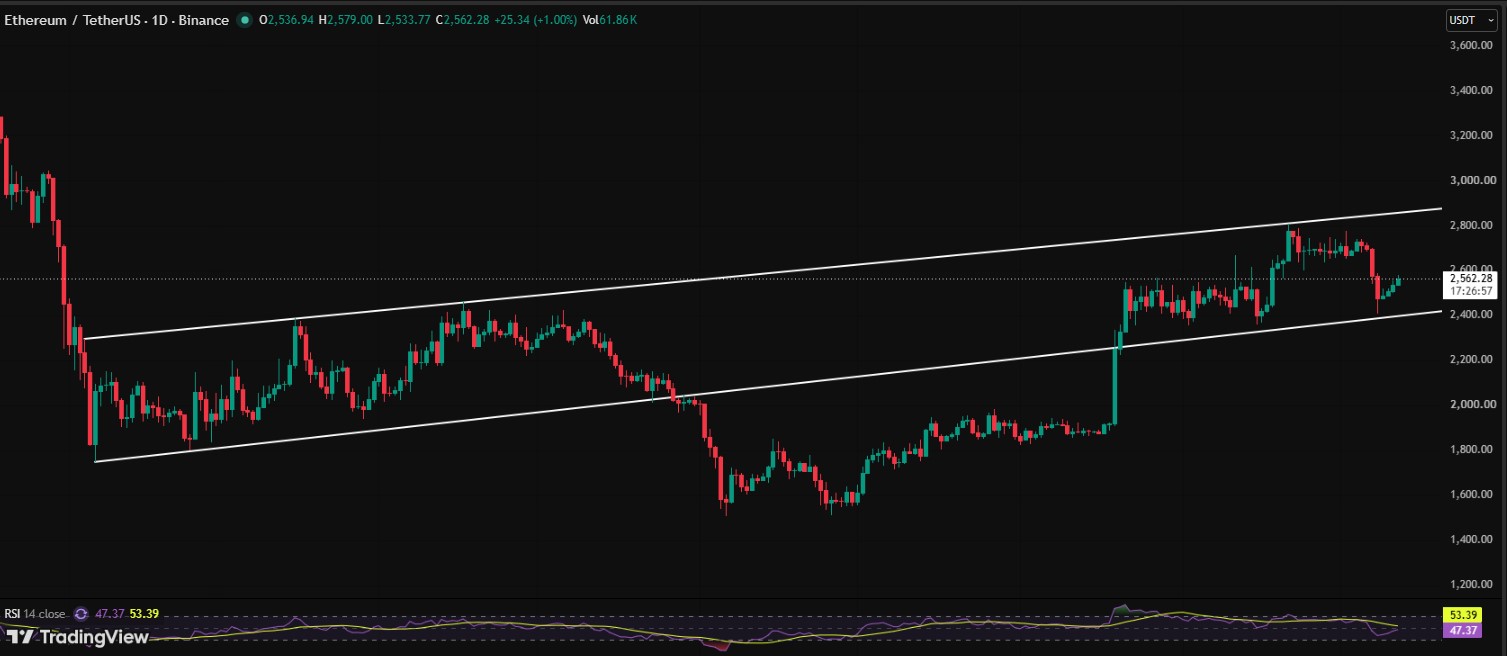
Disclaimer
This article is for information only. It is not financial, investment or trading advice. Crypto prices are volatile, and you can lose money. Do your own research and speak with a licensed financial advisor before making any decision.

















