Gold Price Prediction: Gold’s Bear Market Finally Ending! Here’s Why?


Gold is about 27% below its 52-week high, and posts on X are split on what comes next. Is the bear market almost over? It is too early to say. One analyst thinks the end is close, but price still sits below both key trend lines.
This Gold Price Prediction checks those posts against the daily chart before the October 28 FOMC.
Market data checked on October 22, 2026, at 14:55 IST.
Gold Price Today: Market Overview
Metric | Value |
Current Price | $4,082.66 |
| Gold | #1 |
24h Change (CoinMarketCap) | -0.90% |
Market Cap (CoinMarketCap) | $27.59T |
52-Week Range (CoinMarketCap) | $1.96K – $5.59K |
Gold News Today: "Half a Trillion" Collapse Claim
A post on X says gold and silver lost another half a trillion dollars in market cap in 24 hours. Any Gold Price Prediction needs verified numbers, and CoinGabbar could not verify this one or silver's data.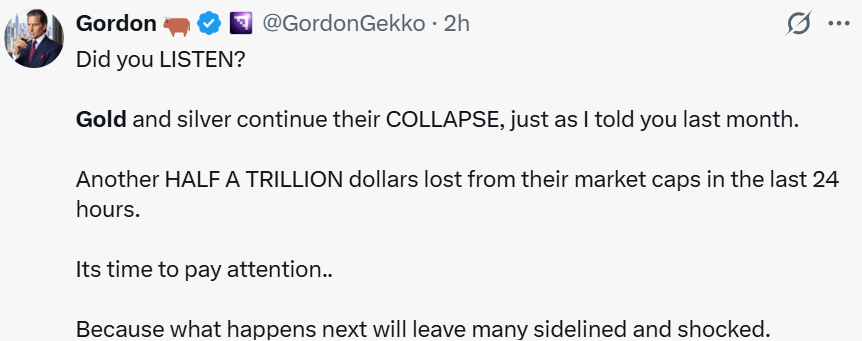
Source: Data From X
For scale, a 0.90% drop on a $27.59T market cap is about $390B for gold alone.
Gold Price Outlook
Gold is in the final innings of its bear market, though it could struggle longer.
Source: Data From X Post 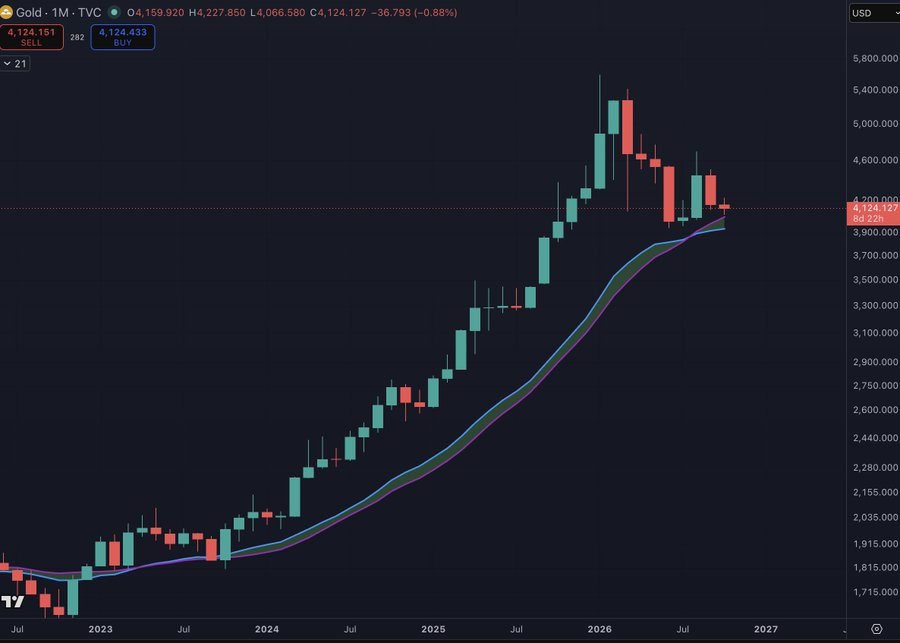
Gold Forecast: Analysts Eye a Bottom Before the FOMC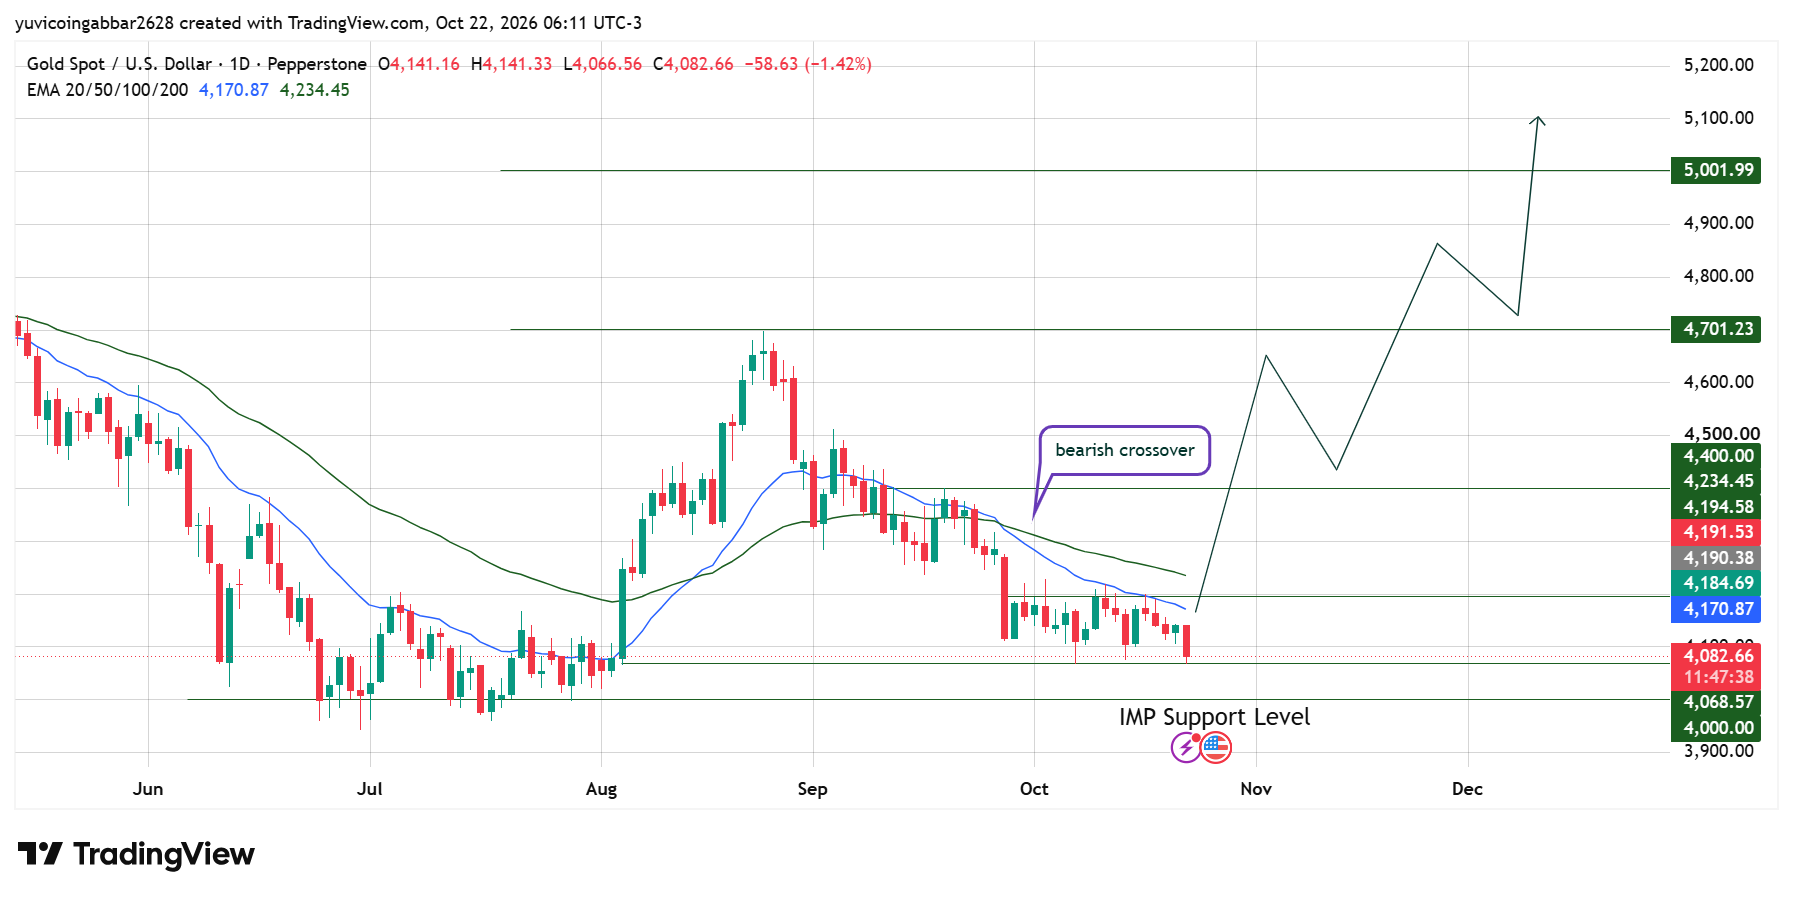
Gold slid from a high near $4,700 in late August to $4,082.66. Today's candle opened at $4,141.16 and fell to a low of $4,066.56, just under the $4,068.57 support, before the reading closed above it.
An EMA is a trend line that weights recent prices more heavily. A bearish crossover happens when the shorter 20 EMA $4,170.87 falls below the longer 50 EMA $4,234.45, which often points to weaker momentum.
Gold could form a major bottom into the FOMC on October 28, 2026, with precious metals running higher into year end. The FOMC, or Federal Open Market Committee, sets US interest rates. See Weather 4,000 IMP Support Hold Gold or Price Crash
Gold Price Forecast: IMP Key Levels
Type | Level |
Highest marked level | $5,000 |
Resistance 2 | $4,700 |
Resistance 1 | $4,400 |
Initial recovery level | $4,194.58 |
Immediate support | $4,068.57 |
Deeper support | $4,000.00 |
Bull case: A daily close above the EMA 50 at $4,234.45 while $4,068.57 holds would put $4,400.00 in play.
Bear case: A drop toward $4,000.00 opens if gold closes a day below $4,068.57.
Gold Scenarios and Invalidation (October 22, 2026)
Scenario | Trigger | Likely Outcome | Invalidation |
Bull | Close above $4,234.45 | Move toward $4,400.00 | Close below $4,068.57 |
Base | Range of $4,068.57 to $4,194.58 | Sideways under the EMAs | Break of either level |
Bear | Close below $4,068.57 | Slide toward $4,000.00 | Close back above $4,068.57 |
Can Gold Reach $5,000?
It would take a gain of about 22.5% from $4,082.66. $Gold would need to clear both EMAs, $4,400.00 and $4,701.23 in order.
The FOMC may add volatility but cannot guarantee a rally.
Gold Price Prediction: Analyst View
Risk stays tilted lower while price is under both EMAs, and a daily close below $4,068.57 would add pressure.
Disclaimer
This article is for informational purposes only and isn't financial advice. Commodity and crypto markets are volatile. Always do your own research before making any trading decisions involving gold.