PAX Gold Price Prediction: Short-Term Levels as PAXG Crash Sharply!


PAX Gold fell about 9% from its $4,121.46 high, and PAXG now trades at $3,755.99 after breaking a rising trendline.
This PAX Gold Price Prediction looks at the 4-hour chart, EMA data and the levels that matter next. A close back above $3,832.09 would be the first sign of recovery.
Market data checked on November 18, 2026, at 17:11 IST.
Why is the PAX Gold price down today?
PAX Gold price today is down 2% to $3,755.99 in 24h, falling while Bitcoin and the broader crypto market edged higher; the move looks more tied to weakness in gold than to crypto market beta, primarily driven by pressure on gold from a stronger dollar and rising rate expectations.
Reason: Gold’s selloff, amid dollar strength and expectations of higher interest rates, is weighing on this gold-backed token.
PAXG Liquidation Data: Longs Hit as Price Fell
A liquidation is a forced close of a leveraged trade when the trader can no longer cover losses. Longs bet on a rise, and shorts bet on a fall.
Window | Total Liquidated | Long | Short |
1h | $101.92 | $0 | $101.92 |
4h | $73.66K | $73.56K | $101.92 |
12h | $297.03K | $296.93K | $101.92 |
24h | $325.27K | $311.95K | $13.32K |
Source: Data From CoinGlass
Longs took about 96% of the $325.27K liquidated over 24 hours, and almost all of the 12-hour and 4-hour totals. That fits the drop below the trendline, though liquidations do not prove why price moved. The amounts are small.
What Is PAX Gold (PAXG)?
PAX Gold is a tokenized gold product issued by Paxos. Each $PAXG token is meant to represent one fine troy ounce of physical gold. Because of that, the $PAXG price today tracks the spot gold price closely.
PAX Gold Price Prediction 2026: Short-Term Technical analysis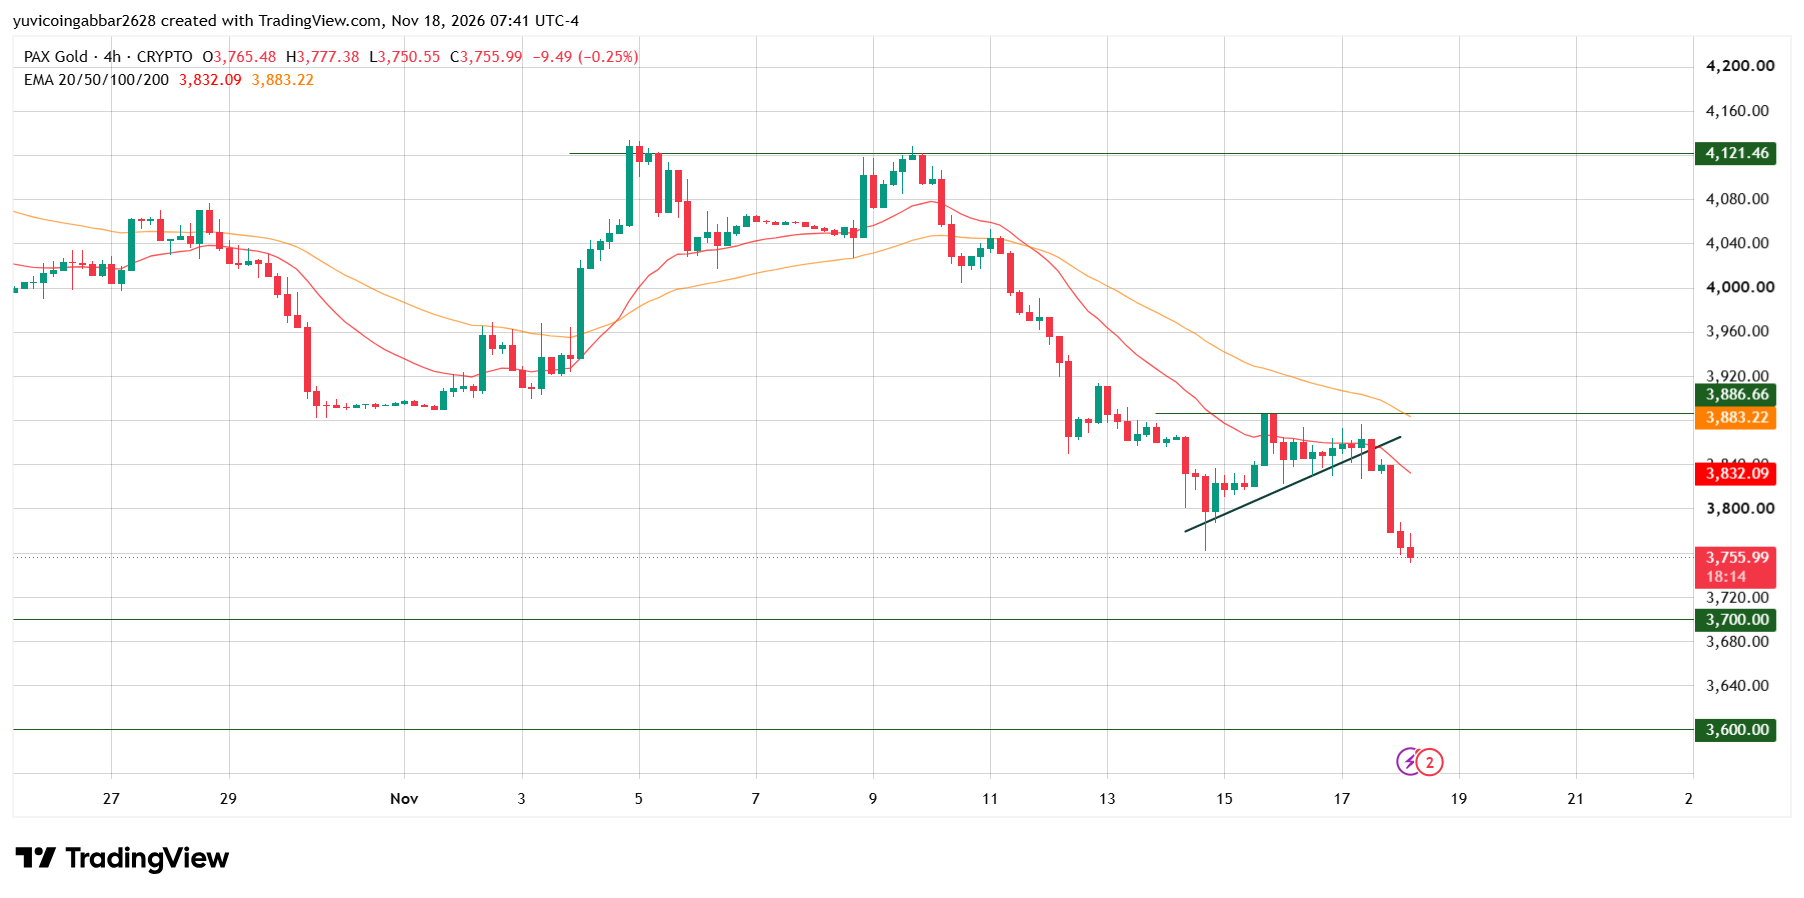
PAXG formed highs near $4,121.46 in early November, and the chart marks that level with a resistance. Price then fell through the second week of the month. A rise on November 15 stalled just under $3,886.66, which is the resistance.
A short rising trendline was drawn from the November 14 low. $PAXG slipped under it on November 17, and a large red 4-hour candle followed.
EMA, or exponential moving average, averages recent closes and gives more weight to newer candles. Price sits below both EMAs, and EMA 20 at $3,832.09 is under EMA 50 at $3,883.22.
$PAXG Support and Resistance Levels
Type | Level |
Highest marked level | $4,121.46 |
Resistance zone | $3,886.66 |
Initial recovery level | $3,832.09 (EMA 20) |
Immediate price reference | $3,755.99 |
First marked support | $3,700.00 |
Deeper support | $3,600.00 |
PAX Gold Price Prediction Scenarios (November 18, 2026)
Bull scenario: In this PAXG Price Prediction, A 4-hour close above $3,832.09 would point to a move toward $3,886.66. The setup fails if $PAXG closes back below $3,832.09.
Base scenario: If $PAXG holds between $3,700.00 and $3,832.09, the price would likely move sideways. Without a close beyond either level, the chart stays undecided.
Bear scenario: A 4-hour close below $3,700.00 would open a slide toward $3,600.00. The setup fails if $PAXG closes back above $3,700.00.
PAX Gold Price Prediction: Can $PAXG Reach $4,121.46 Again?
The highest marked level, $4,121.46, is about 9.7% above $3,755.99. Any gold price prediction toward it needs $PAXG to reclaim the trendline, EMA 20, EMA 50 and $3,886.66 first.
Since the price is below all of them, a quick return looks unlikely on this chart. See our $PAXG price history.
PAX Gold Price Prediction: CoinGabbar Technical Read
The short-term trend is down. Price broke its rising trendline, trading under both EMAs, and mostly hit long traders.
Only a close above $3,832.09 would show early recovery, while a close below $3,700.00 would keep sellers in control. Check our gold price outlook and our latest crypto price predictions.
Disclaimer
This article is for informational purposes only and isn't financial advice. Crypto and gold markets are volatile. Always do your own research before making any trading decisions involving PAXG.
















