Pepe Price Prediction October 2026: Is the Breakout Retest Holding?


The Pepe Price Prediction October 2026 debate starts with a gap between mood and distance. PEPE is rising and trading is active, yet the token still sits more than 80% below its December 2024 all-time high.
Pepe (PEPE) launched in April 2023 as an Ethereum-based meme token inspired by the Pepe the Frog internet character. Its supply is fixed at 420.69 trillion tokens.
The Pepe price today is $0.00000436, up 1.2% in 24 hours. The Pepe Coin ranks 57th by market value, with a market cap of $1.835 billion and a 24-hour trading volume of $348.065 million.
Live PEPE Market Data
Metric | Value |
Price | $0.00000436 |
24h Change | +1.2% |
24h Range | $0.00000424 to about $0.00000450 |
Market Cap | $1.835B |
Source: market data taken from CoinGecko, as of Oct 1, 2026. Figures may vary slightly across other tracking websites.
Futures open interest equals about 41% of market cap and is more than twice daily trading volume. Leveraged positions of that size can amplify a weekly move in either direction.
Pepe News Today: Breakout Chatter and Volume Watch
A widely shared post this week argued that a clean PEPE breakout with volume could change the structure quickly. 
Source: Data Taken From @terra_army post on X, October 1, 2026
The attached daily chart sketches a rising channel and a projected move of about 51%, from roughly 0.00000419 toward 0.00000632.
The post also carried a promotional graphic promising a 100x run.
That image is marketing and not analysis, so this article does not treat it as a forecast.
The useful part of the post is the volume condition. It matches what the weekly chart below requires.
Pepe Technical Analysis: Weekly Trendline Breakout and Retest
On the weekly chart, PEPE has broken above the falling trendline drawn from the November 2025 highs. Price is now coming back to test that line from above.
The last weekly candle spiked to about 0.0000053 before sellers pushed it back, which shows higher prices are still being defended.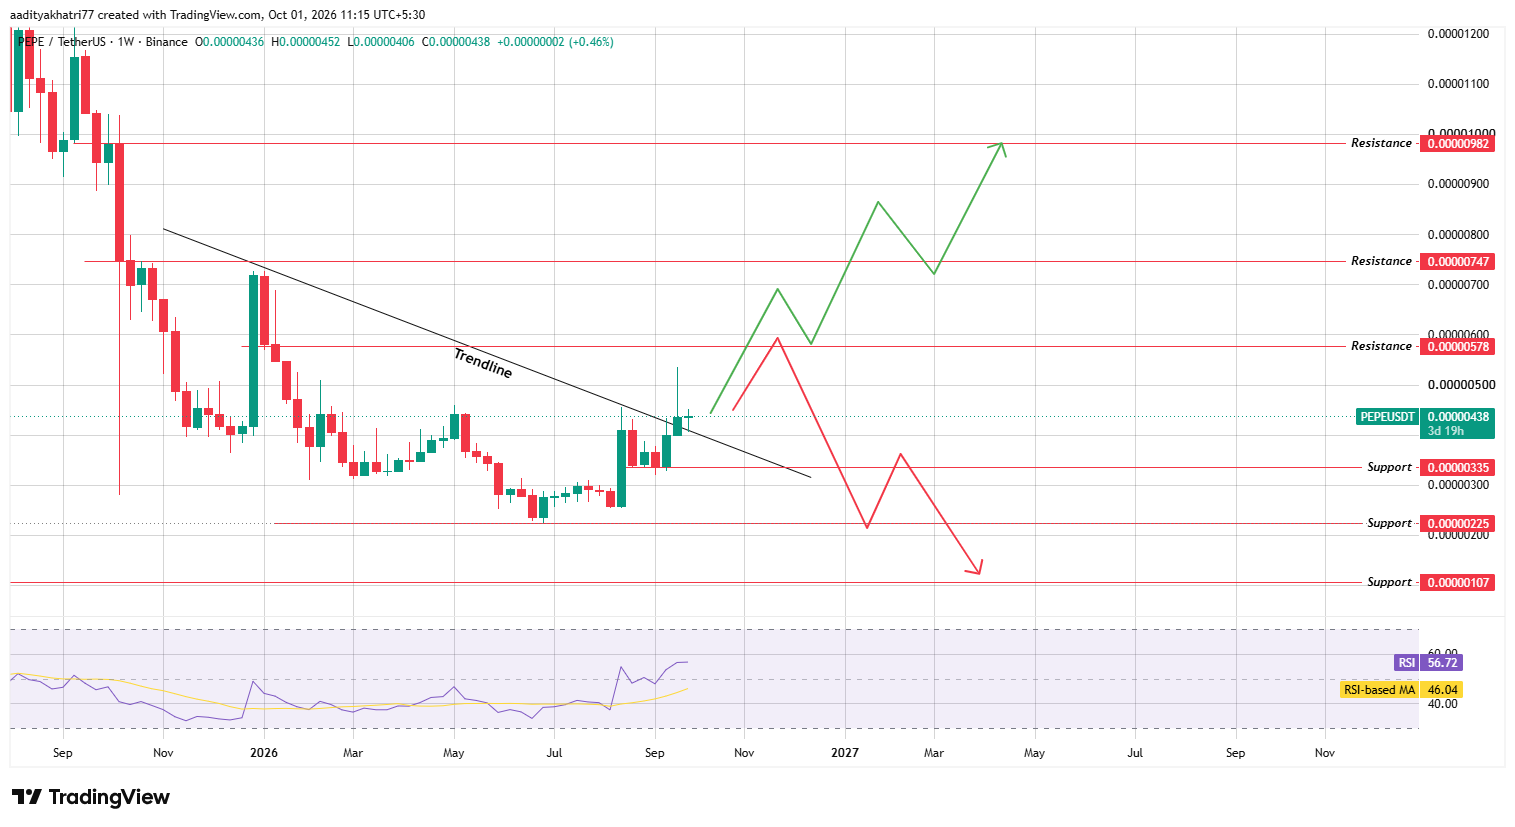
Source: Data taken from TradingView, Binance PEPEUSDT 1W chart, captured at 11:15 AM IST (UTC+5:30), October 1, 2026
The current candle opened at 0.00000436 and trades at 0.00000438, so it is green by a narrow margin. It closes on Monday, October 5, at 5:30 AM IST (00:00 UTC), and every level here refers to weekly closes.
RSI reads 56.72 and sits well above its moving average of 46.04. Momentum has improved, and the reading is not yet overbought.
Pepe Price Prediction October 2026: Can $PEPE Reach $0.00000578?
Buyers need the weekly candle to close green, meaning above its 0.00000436 open, while holding the trendline.
They also need volume above the average of the previous 20 weekly candles.
A close above $0.00000578 on that volume would be the next confirmation, about 32.0% above the current price.
Beyond that, the chart targets $0.00000747, roughly 70.5% higher, and then 0.00000982, near 124.2% higher.
The green path expects pullbacks after each leg. Those pullbacks would retest broken resistance and would not cancel the move.
What Happens If $PEPE Is Rejected at $0.00000578?
If sellers defend 0.00000578, $PEPE would likely fall back through the trendline toward $0.00000335, about 23.5% lower.
A weekly close below that level would turn the breakout into a failed one.
The chart then shows a drop to $0.00000225, about 48.6% below the current price. The last step is 0.00000107, roughly 75.6% lower.
That is an extreme case, and it would erase nearly all of the 2026 recovery.
Price Levels to Watch
Support | Resistance |
$0.00000335 | $0.00000578 |
$0.00000225 | $0.00000747 |
$0.00000107 | $0.00000982 |
Bull, Base, and Bear Scenarios
Scenario | Setup | Level |
Bull | Green weekly close above $0.00000436 near the trendline, then a close above $0.00000578 on above-average volume | $0.00000747, then $0.00000982 |
Base | Price holds near the trendline without a decisive weekly close. | $0.00000335 to $0.00000578 |
Bear | Rejection at $0.00000578, then a weekly close below $0.00000335 | $0.00000225, then $0.00000107 |
PEPE vs Bitcoin
PEPE gained 1.2% against the dollar and 0.3% against Bitcoin over 24 hours. That suggests Bitcoin itself rose about 0.9%.
PEPE usually follows Bitcoin's direction with much wider swings, so a weak BTC week could push the price back under the trendline.
Anyone following this Pepe price prediction 2026 outlook should watch Bitcoin alongside the levels above.
Expert Opinion
General market commentary on PEPE this week centers on one idea: the breakout only counts if volume confirms it.
That view fits the chart behind this Pepe price prediction. A green weekly close above the trendline, followed by a close above $0.00000578, would carry far more weight than any social media forecast.
Until then, the retest is unfinished, and the price can still slip back under the line.
Disclaimer: This article is for information only and is not financial advice. Pepe is a highly volatile meme token, and a weekly close below $0.00000335 could lead to much deeper losses. Trendline breakouts fail often, and no probability can be assigned to any scenario here. You can lose part or all of your capital, so do your own research before making any decision.











.webp)










