Gold/Silver Ratio Eyes a Breakout as Peter Brandt Spots ATH Setup


The Gold/Silver ratio is pressing against a key level, and veteran trader Peter Brandt thinks a bigger move could follow. In an X post, he said the pair "might take a run at an ATH."
The ratio now sits near 74. That is a sharp bounce from its 2026 low, even as both metals sell off.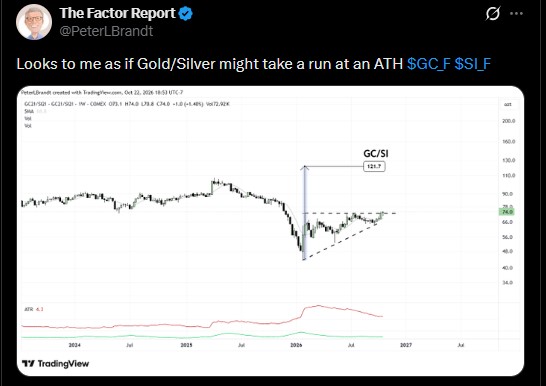
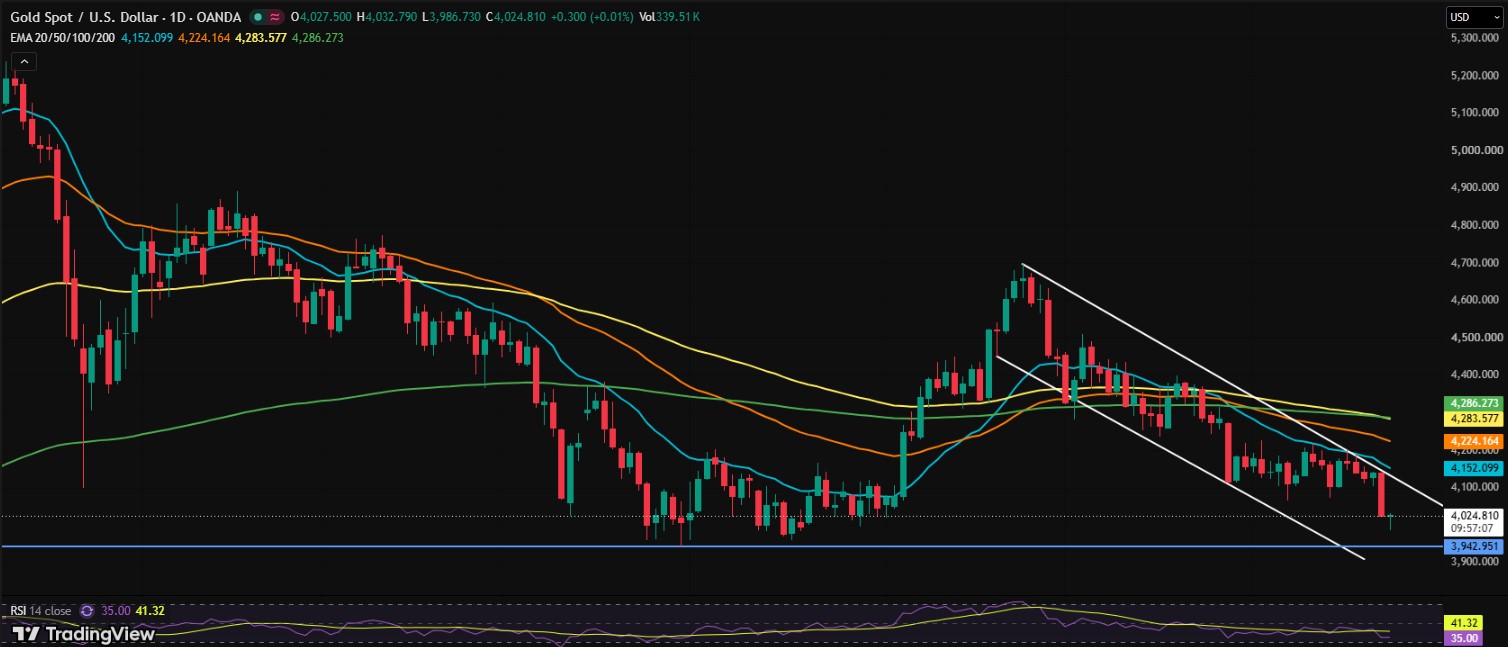
Gold trades near $4,022. Silver is close to $54.
What Is the Gold/Silver Ratio and How Is It Calculated?
The ratio shows how many ounces of silver it takes to buy one ounce of gold. You get it by dividing the gold price by the silver price.
Right now, $4,022 divided by $54 gives about 74.
When the ratio rises, gold is beating silver. That can happen if gold climbs faster, or if silver falls faster. This time, silver has dropped harder.
Why Is Peter Brandt Bullish on the Gold/Silver Ratio?
Brandt shared a weekly GC/SI chart showing the ratio near 74. After a steep fall early in 2026, it has climbed back and pushed above a flat resistance line.
His chart shows a rising triangle breakout. The target marked on it is 121.7.
That would be a new high on his chart. The ratio topped 100 in 2025, then slid to the mid-40s in early 2026.
A chart target is not a promise. Breakouts can fail.
Many traders see readings above 90 as a sign gold is expensive against silver. At 74, the ratio is still well below that.
Why Are Gold and Silver Falling Today?
Gold dropped $116 in one session and closed just above $4,000. It briefly slipped under that level on Friday, the lowest in nearly three months. Silver fell to its lowest level in 11 months.
Traders seem worried about a tech selloff and an unwind of the leveraged AI trade. Both metals are also under pressure on expectations that Fed rates could stay higher for longer.
Rising oil prices and inflation worries tied to the US-Iran war add more noise.
Peter Schiff sees it differently. He wrote that gold already corrected, and that a stock market crash would be bullish for it.
What Are the Gold and Silver Prices Today?
Asset | Price | RSI | 20 EMA | 50 EMA | 100 EMA | 200 EMA |
Gold | About $4,022 | Near 35 | $4,152 | $4,224 | $4,284 | $4,286 |
Silver | About $54 | Near 31.6 | $58.70 | $61.27 | $63.58 | $64.26 |
Both metals trade below all four moving averages. Gold is about a quarter under its peak above $5,400. Silver is down more than half from its early 2026 high near $121.
What Are the Support and Resistance Levels for Gold and Silver?
Gold sits inside a descending channel on the daily chart. Silver has slipped under $55, the base of its descending triangle.
Metal | Support | Resistance |
Gold | $3,943, then $3,900 to $3,850 | $4,100 to $4,150, then $4,220 to $4,285 |
Silver | $53.40 to $53.00, then $51.50 and $50 | $55 to $56, then $58.70 |
On the weekly silver chart, $45 is the next big support if $55 stays lost.
Low RSI readings leave room for a short bounce. The trend still points down for now.
Could Gold Fall to $2,533?
Brandt also posted a weekly gold futures chart. It shows a drop from near $4,000 that would erase all of gold's 2025 gains.
The target is $2,533, with a neckline near $3,906. He said he is "not predicting" it.
An Oct. 9 chart showed a head and shoulders pattern with a $2,890 target. Both are scenarios, not forecasts.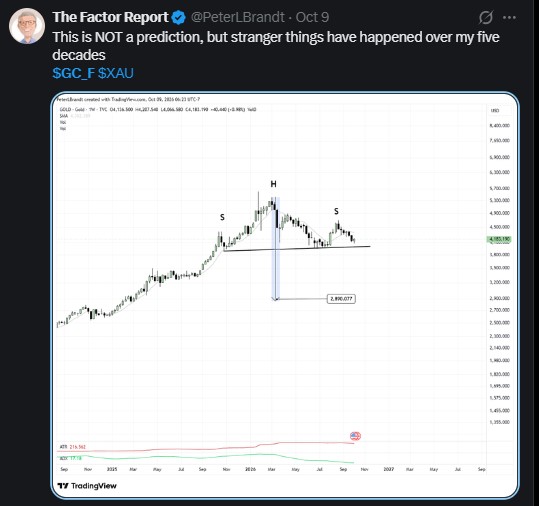
Where Are Gold and Silver Headed Next?
If the Gold/Silver ratio holds above its breakout zone, gold may keep beating silver. That does not mean gold rises. Silver could simply fall more.
Watch gold's $3,943 and silver's $53 zone. A move back above $4,100 and $55 would be the first sign sellers are tiring.
Separately, JPMorgan expects Bitcoin to beat gold, US stocks, and bonds over the next 10 to 15 years, with about 10% yearly returns.
Disclaimer
This article is for information only and is not financial, investment, or trading advice. Gold, silver, and related markets are volatile, and you can lose money. Chart targets are scenarios, not guarantees. Do your own research and speak with a licensed financial advisor before making any decision.

















