Bitcoin Price Prediction: BTC Wobbles Ahead of Fed Decision Call


Bitcoin price is trading above $64,000, up 1.06% in the last day. But it later slipped toward $62,714 as traders trimmed positions ahead of the Federal Reserve's rate decision.
This Bitcoin price move comes down to one big event. The Fed meeting on July 29, 2026 could shake up the whole crypto market.
Leveraged liquidations, spot ETF outflows, and rate worries all added pressure. Traders are now waiting on the policy call and comments from Kevin Warsh.
What is the Fed rate decision doing to Bitcoin?
The Fed started its two-day meeting on July 28. A decision is due Wednesday, and this one was hard to call.
Markets priced in a 70.6% chance of no change to the 350-375 bps range, and a 29.4% chance of a hike, based on CME-style futures data.
A stable rate would likely calm markets down. But Warsh's comments could still stir up volatility either way.
Warsh has kept a tight lip since taking office. He also set up task groups looking into inflation, AI, and economic data, so a surprise hike this early could look premature.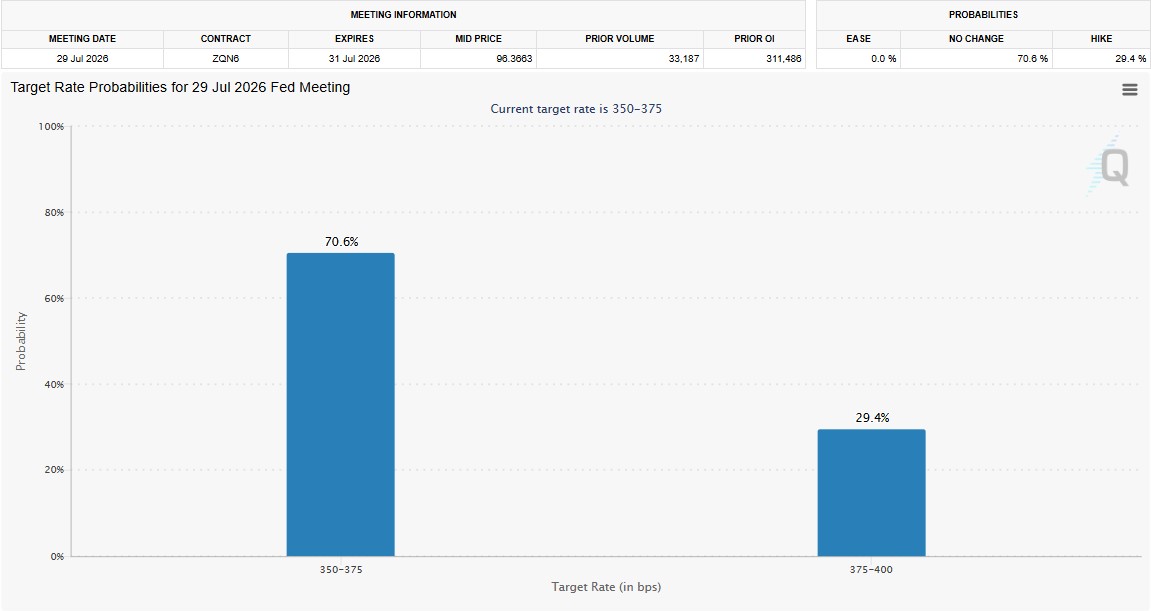
Why are Bitcoin ETFs seeing outflows?
U.S. spot BTC ETFs posted $49.75 million in net outflows on July 28. BlackRock's IBIT led the retreat with a $54.83 million single-day outflow.
Date | Daily Net Inflow | Total Net Assets |
Jul 28, 2026 | -$49.75M | $77.23B |
Jul 27, 2026 | -$11.64M | $78.71B |
Jul 24, 2026 | -$240.08M | $78.82B |
Jul 23, 2026 | -$225.18M | $80.36B |
Jul 22, 2026 | +$68.99M | $80.94B |
Jul 21, 2026 | +$203.14M | $79.16B |
Jul 17, 2026 | +$132.30M | $77.74B |
The pattern shows shaky demand. Investors have been pulling back from Bitcoin funds across several sessions in late July.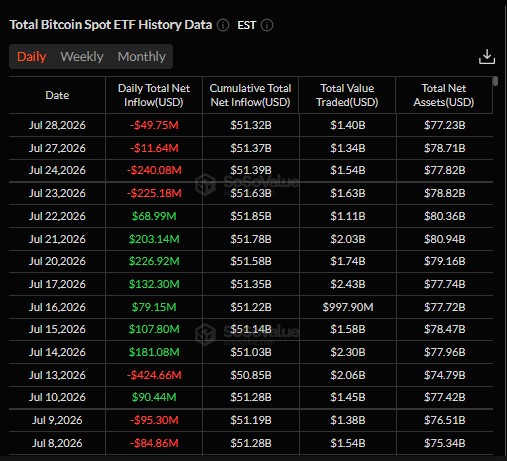
What price levels matter for Bitcoin in August 2026?
Short-term support sits near $59,500 to $60,000, based on recent trading ranges.
Below that, the next real floor lines up closer to $45,000 to $48,000. That zone matches the drop targets seen after past death cross events.
On the upside, BTC price faces resistance near $67,500 to $70,000 first. A tougher cap sits around $84,000 to $88,000, where the SMA 50 and SMA 100 currently sit on the weekly chart.
A close below $59,500 opens the door to that death cross zone. A close back above $70,000 with strong volume would support a wedge breakout thesis, one analyst pegged at $116,000 as a medium-term target.
What is a death cross and why does it matter for Bitcoin?
A death cross happens when the 50-day moving average crosses below the 100-day moving average.
Analyst Crypto Rover flagged this pattern on the weekly chart. The last two times it formed, BTC dropped close to 30% afterward, marked at -30.29% and -38.48%/-39.33% in the shared charts.
Death crosses don't always repeat the same way. They're lagging signals, so much of the drop may already have happened by the time the cross confirms.
Still, some traders worry this could pull BTC toward the $45,000 to $48,000 zone if history rhymes again.
Does the 4-year cycle theory still apply to Bitcoin?
Analyst Ali Charts pointed to the 4-year cycle theory in a recent post. If it holds, BTC could mark its next major bottom between October 6 and October 16, 2026.
This lines up with prior cycle bottoms traced back to 2017, 2020, and 2023 on his chart.
Not everyone agrees these cycles will keep repeating as adoption and market structure change. But it remains a widely watched framework among traders.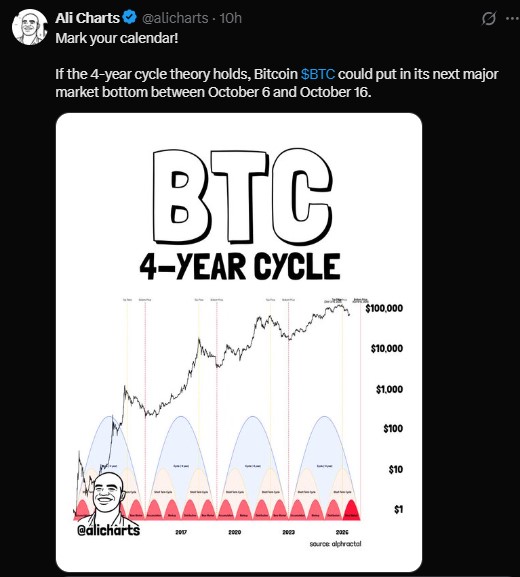
Is a bullish breakout still on the table for Bitcoin?
Analyst Javon Marks pointed to a falling wedge-like pattern on the BTC chart. A successful breakout, he noted, could open the door to a bull move.
His first target on a breakout sits near $116,000, with all-time highs as the next stop after that.
That view depends on BTC holding key support and reclaiming levels above $70,000 with real volume behind it.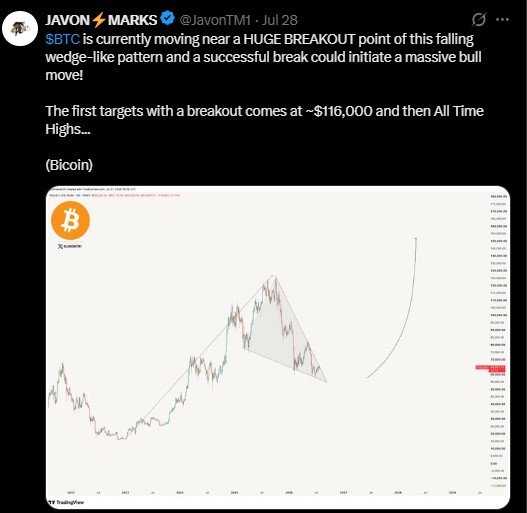
Bottom line for Bitcoin price direction
The Fed decision, ETF flows, and technical chart patterns are all pulling at once.
A stable rate decision paired with a reclaim above $70,000 would support the bullish wedge case. A break below $59,500 would shift focus toward the $45,000 to $48,000 zone instead.
No one can say for certain which way it goes. Traders are watching price action closely into August 2026.
Disclaimer
This article is for informational purposes only and does not constitute financial, investment, or trading advice. Cryptocurrency markets are highly volatile and risky. Always do your own research and consult a licensed financial advisor before making any investment decisions.









.jpg)








