Bulla Price Prediction: History Repeats, Could 200% Returns Be Next?


$BULLA coin news is spreading fast today after the Bulla token price broke out with one of its loudest moves yet, jumping over 40% as volume exploded more than 260% in a single day.
This Bulla price prediction covers the liquidation data, the exchange volume behind the move, and the key levels that decide whether this breakout holds.
Market data was checked on September 3, 2026, at 15:19 IST.
Bulla Price Prediction Today: Market Overview
Metric | Value |
Price | $0.026271 |
24h Change | +40% |
Market Cap | $26.48M |
Unlocked Market Cap | $13.36M |
FDV | $26.48M |
24h Volume | $5.4M |
Vol/Mkt Cap (24h) | 20.64% |
Liq/Mkt Cap | 0.89% |
Total Supply | 1B BULLA |
Max Supply | 1B BULLA |
Circulating Supply | 1B BULLA |
Holders | 59.83K |
Source: Data from CoinMarketCap as of September 3, 2026, at 15:19 IST. Figures may vary slightly across other tracking websites.
$BULLA Liquidation and Volume Data
Short sellers took the brunt of the damage as $BULLA broke out.
Total liquidations over 24 hours hit $510.99K, split between $99.98K in long liquidations and $411.01K in short liquidations.
The 12-hour window shows the same pattern, with $319.46K in shorts wiped out against just $89.00K in longs, a sign traders betting against the move got forced out fast.
Futures volume is dominated by Binance at $64.90M, with MEXC at $5.49M, Aster at $2.88M, and Gate rounding out the rest.
$BULLA Chart Analysis
Pair: BULLA/USDT · Market: Crypto · Timeframe: 1D · Source: TradingView · Timestamp: September 3, 2026, 14:19 UTC+5:30
Bulla is trading at $0.026271, up 40% on the 1D candle.
Price broke sharply above a long horizontal resistance at $0.020436 that had capped it since April, following months of a steady downtrend and base-building through summer.
EMA 20 sits at $0.017945 and EMA 50 at $0.015253, both well below the current price and now acting as support after this breakout.
Above, resistance levels sit at $0.030115, $0.040116, $0.050355, and $0.070004, with $0.030115 the immediate hurdle to clear next.
The key is whether the price can hold the current support level at $0.020436 to stay in a bullish Trend. 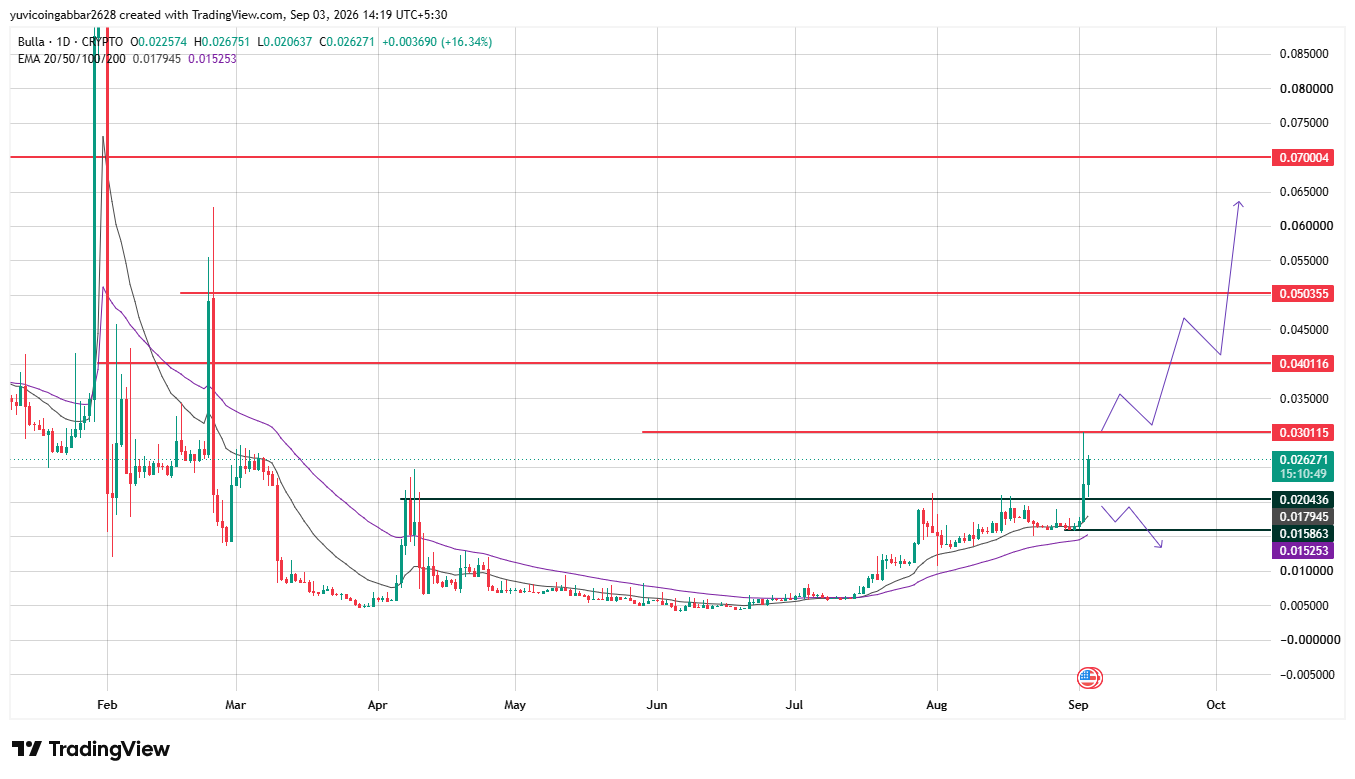
Bulla Price Today: Key Levels
Level | Price |
Resistance 4 | $0.070004 |
Resistance 3 | $0.050355 |
Resistance 2 | $0.040116 |
Resistance 1 | $0.030115 |
Immediate Price Reference | $0.026271 |
Support 1 | $0.020436 |
Support 2 | $0.015863 |
Bull Case vs Bear Case
Bull case: Holding support 1 at $0.020436 and clearing resistance 1 at $0.030115 keeps the breakout alive and opens room toward $0.040116.
Bear case: A close back below $0.020436 would put the breakout in doubt, with support 2 at $0.015863 as the next downside level.
Can $BULLA Reach $0.070004?
$0.070004 is the highest level on the chart.
Getting there would take $BULLA clearing $0.030115 first, then $0.040116 and $0.050355, a multi-stage move rather than a single leg from here.
$BULLA vs Bitcoin price prediction:
Bitcoin has stayed fairly steady this week, with most bitcoin price prediction talk centered on BTC price holding its range rather than making a big move.
$BULLA is the opposite story, up more than 35% in a day on volume that jumped over 260%.
That kind of swing is normal for a small-cap meme coin catching a wave of attention, but it also means $BULLA can move far more violently than Bitcoin in either direction.
Bulla Price Prediction 2026: Expert View
According to CoinGabbar analysts, The liquidation data backs the breakout story. Shorts took the bigger hit, and the price is now trading above its EMA cluster for the first time in months.
The $0.020436 to $0.030115 zone is the one to watch.
Disclaimer
This article is meant to inform, not to tell you what to do with your money. The levels covered here come from chart analysis and data that was public at the time of writing, and BULLA has already shown how fast that can change in a single day. Treat this as one input among many, do your own research, and only risk what you can afford to lose.
















