Cash Cat Price Prediction: $CASHCAT Eyes 100% Rally to $0.50?


$CASHCAT just set a fresh all-time high above $280M in market cap, and now the CASHCAT price is giving some of that move back.
Price sits at $0.25421, down -12 on the day, after one of the sharpest runs on Robinhood Chain this year.
This Cash Cat price prediction looks at why the pullback is happening, what the liquidation data shows, and the levels that decide if CASHCAT crypto holds its gains or slips further.
Market data was checked on September 3, 2026, at 12:54 IST.
Cash Cat Price Prediction Today: Market Overview
| Metric | Value |
| Price | $0.25421 |
| 24h Change | -12% |
| Market Cap | $258.84M |
| FDV | $256.88M |
| 24h Volume | $90.55M |
| Vol/Mkt Cap (24h) | 35.22% |
| Liq/Mkt Cap | 6.03% |
| Total Supply | 1B CASHCAT |
| Max Supply | 1B CASHCAT |
| Circulating Supply | 1B CASHCAT |
Source: Data from CoinMarketCap as of September 3, 2026, at 12:54 IST. Figures may vary slightly across other tracking websites.
Why Cash Cat Is Pulling Back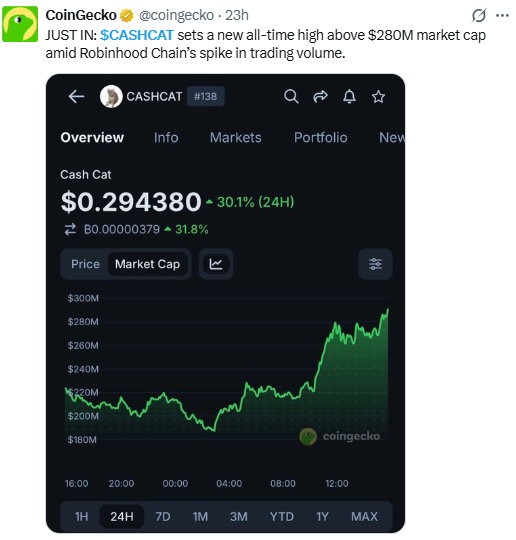
Source: Data From CoinGecko
$CASHCAT rallied hard enough to set a new all-time high above $280M in market cap within the past day, according to CoinGecko, before sellers stepped in and took some of that move back.
So far this looks like profit-taking after a sharp run rather than a change in the broader trend.
What Traders Are Saying
Source: Data From X
Crypto commentator Drallio recently argued that $CASHCAT has become more than just another Robinhood Chain token, pointing to over 100,000 holders, direct Robinhood exposure, strong meme lore, and one of the most active communities on the chain as reasons it could keep capturing attention if Robinhood Chain keeps growing.
$CASHCAT Liquidation and Volume Data
Liquidations over the past 24 hours totaled $227.91K, split between $92.12K in long liquidations and $135.79K in short liquidations.
The 12-hour window tells a similar story, with $100.23K in shorts wiped out against just $14.37K in longs, a sign the rally caught short sellers off guard before the pullback started.
Futures volume is led by LBank at $80.14M and Hyperliquid at $51.89M, with Bybit at $46.95M and smaller exchanges rounding out the rest.
Source: Data From CoinGlass
On the DEX side, $CASHCAT trading volume has stayed active through the pullback, another sign the drop looks like profit-taking rather than a loss of interest.
$CASHCAT Chart Analysis
Pair: CASHCAT/USDT · Market: Crypto · Timeframe: 1D · Source: TradingView · Timestamp: September 3, 2026, 12:54 UTC+5:30
CashCat is trading at $0.25421, down 12% on the 1D candle.
Price broke out of a descending channel in late August and rallied sharply into early September, tagging the $0.29783 (1.0 Fib) level before this pullback.
Key Fibonacci resistance levels above sit at $0.37570 (1.618) and $0.50169 (2.618), while $0.23999 and $0.19695 mark horizontal support below.
The $0.24970 (0.618 Fib) zone lines up closely with the current price, making it the immediate level to hold for the breakout to stay valid.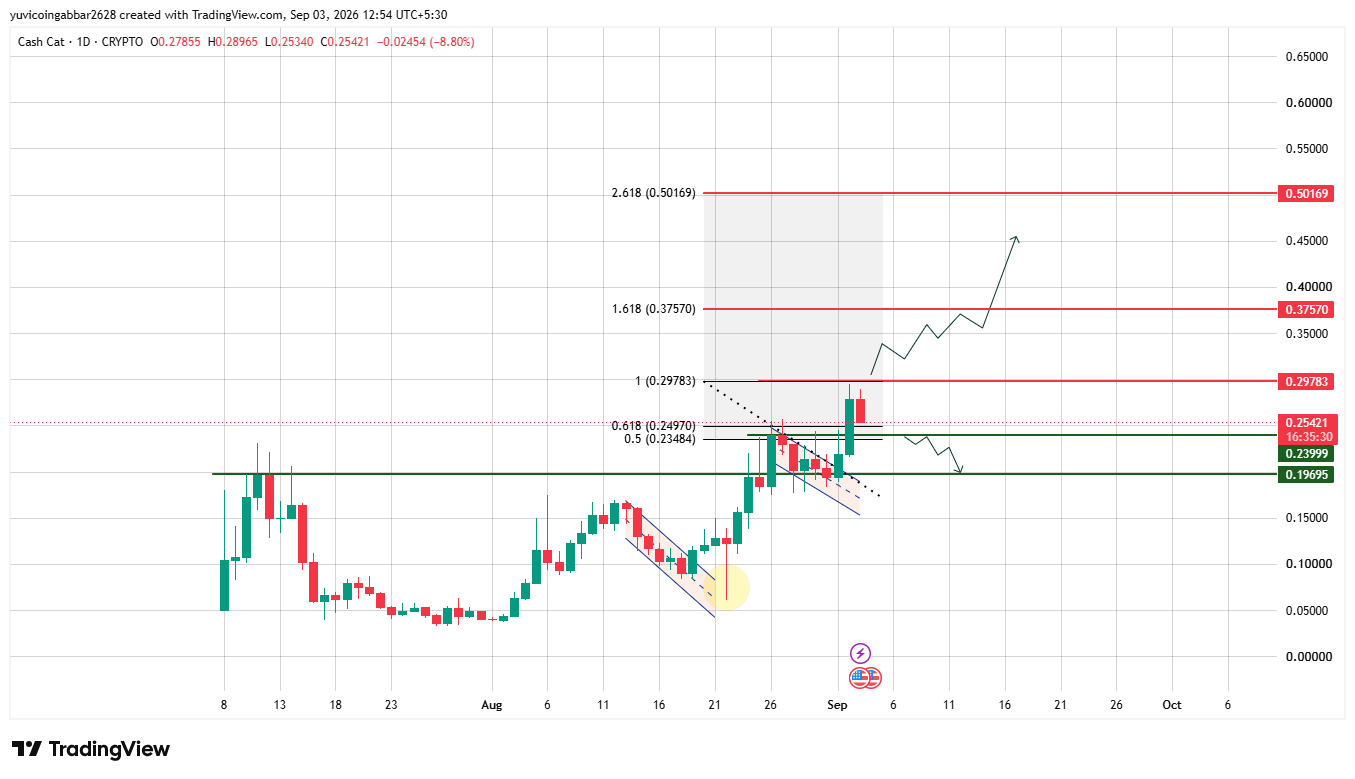
CASHCAT Price Today: Key Levels
| Level | Price |
| Resistance 3 | $0.50169 |
| Resistance 2 | $0.37570 |
| Resistance 1 | $0.29783 |
| Immediate Price Reference | $0.25421 |
| Support 1 | $0.23999 |
| Support 2 | $0.19695 |
Bull Case vs Bear Case
Bull case: Holding support 1 at $0.23999 and reclaiming resistance 1 at $0.29783 would put the all-time high breakout back in play, opening room toward $0.37570.
Bear case: Losing support 1 at $0.23999 would put the pullback at risk of deepening toward support 2 at $0.19695.
Can $CASHCAT Reach $0.50169?
$0.50169 is the highest level on the chart.
Getting there would take $CASHCAT reclaiming $0.29783 first, then clearing $0.37570, a multi-stage move well beyond the current pullback.
Cash Cat vs Bitcoin: How the Move Compares
Bitcoin has stayed relatively calm this week, with most bitcoin price prediction chatter focused on BTC price holding a tight range rather than any sharp move.
$CASHCAT is the opposite story, swinging nearly -12% in a single day right after setting a fresh all-time high.
That kind of volatility is normal for a memecoin riding fresh attention on Robinhood Chain, but it also means CASHCAT can give back gains far faster than Bitcoin does, so position size should account for that gap.
Cash Cat Price Prediction 2026: Expert View
According to CoinGabbar analysts , Shorts took the bigger hit over the past day, which lines up with a fast breakout rather than a slow grind.
The $0.23999 to $0.29783 zone is the one to watch, holding it keeps the breakout thesis alive.
Disclaimer
This article is meant to inform, not to tell you what to do with your money. The levels covered here come from chart analysis and data that was public at the time of writing, and CASHCAT has already shown how fast that can change in a single day. Treat this as one input among many, do your own research, and only risk what you can afford to lose.
Also read:
















