Cash Cat Price Prediction Today: Can It Reach $0.23000?


Cash Cat has been one of the more active names on trader watchlists lately, and this Cash Cat price prediction looks at what could come next after a sharp shift in structure.
CASHCAT spent days climbing steadily before suddenly losing that momentum, and now the market is watching closely to see whether the recent pullback finds a floor or continues deeper.
This piece is prepared by CoinGabbar's technical desk using the chart structure and live data supplied for today's session. CoinGabbar and the analyst do not hold a position in CASHCAT at the time of publication, and nothing here should be treated as financial advice.
The levels discussed below come from the 1-hour CASHCAT/USDT perpetual futures chart on MEXC via TradingView.
Since this is a short-term intraday setup, these levels should be rechecked if the price closes meaningfully beyond the stated range.
CASHCAT Price Right Now
Metric | Value |
Current Price (CMP) | $0.14175 |
24H Change | -8.94% |
Market Cap | $140.75M |
Futures Volume (24H) | $23.00M |
Spot Volume (24H) | $6.26M |
Open Interest | $28.12M |
Circulating Supply | 1.00B CASHCAT |
Total Supply | 1.00B CASHCAT |
Max Supply | 1.00B CASHCAT |
Open interest is the total value of CASHCAT futures contracts still open and not yet settled.
A rising open interest during this pullback would suggest traders are actively positioning around the current levels, while a falling reading could mean conviction is fading on both sides.
Chart source: TradingView, CASHCAT/USDT Perpetual Futures, MEXC, 1-hour timeframe, captured August 14, 2026, at 15:52 PM IST (10:22 AM UTC).
Market data source: CoinGlass, Cash Cat overview page, captured August 14, 2026.
Methodology and Data Sources
This Cash Cat price outlook is built entirely from the 1-hour chart structure supplied for today's session, combined with live market and volume data from CoinGlass.
No external analyst forecasts or added market commentary have been included.
Every support and resistance level below comes directly from the trendline breakdown, flip zone, and swing levels marked on the chart.
CASHCAT Price Performance Across Timeframes
Cash Cat's short-term numbers show just how sharp the recent swings have been.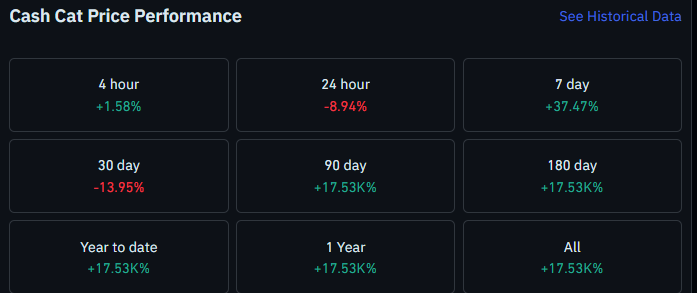
CASHCAT is up 1.58% over the last 4 hours despite being down 8.94% over 24 hours, and the 7-day change still sits at a strong +37.47%. The 30-day figure shows a pullback of -13.95%, though
The longer-term readings across 90 days, 180 days, year-to-date, and 1 year all reflect the token's short listing history with extremely large percentage gains from its early base.
Source: CoinGlass, Cash Cat Price Performance, August 14, 2026.
Liquidation Snapshot: Where Leverage Is Getting Squeezed
CASHCAT liquidations picked up noticeably over the past day.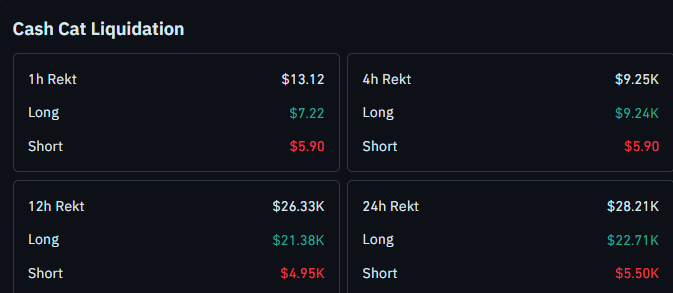
Total liquidations in the last 24 hours came in at $28.21K, with longs accounting for $22.71K against $5.50K in shorts.
The 12-hour window shows a similar imbalance, with $21.38K in long liquidations versus $4.95K in shorts.
On the shorter windows, the 4-hour total came in at $9.25K, almost entirely from longs at $9.24K against just $5.90 in shorts, while the 1-hour window saw a more even split with $7.22 in longs against $5.90 in shorts.
Source: CoinGlass, Cash Cat Liquidation Data, August 14, 2026.
CASHCAT Volume Distribution Across Exchanges
Futures trading in CASHCAT is fairly spread out across venues right now. 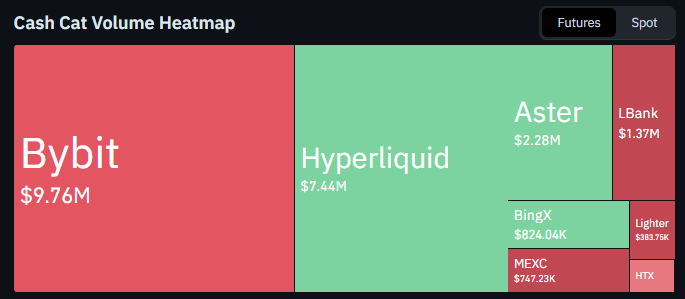
Bybit leads with $9.76M in 24-hour futures volume, followed by Hyperliquid. at $7.44M and Aster at $2.28M. Smaller volumes are spread across LBank at $1.37M, BingX at $824.04K, MEXC at $747.23K, and Lighter at $383.75K.
This kind of multi-exchange distribution suggests demand for CASHCAT is not concentrated on a single platform.
Source: CoinGlass, Cash Cat Volume Heatmap, August 14, 2026.
CASHCAT Trend and Momentum: Key Takeaways
CASHCAT followed an ascending trendline higher before recently breaking down through it
Price retested the broken trendline and has since fallen again but has not yet broken its recent swing low at 0.13637.
A close above 0.18109 with price sustaining above the flip zone opens the path toward 0.20500 and then 0.23313
A close below 0.10589 would confirm the breakdown, with 0.08915 as the next support
Trading activity is spread across several exchanges, led by Bybit and Hyperliquid
Cash Cat Price Prediction: Reading the Trendline Breakdown
CASHCAT spent the earlier part of this week climbing steadily along an ascending trendline, putting in a series of higher lows before that structure finally gave way.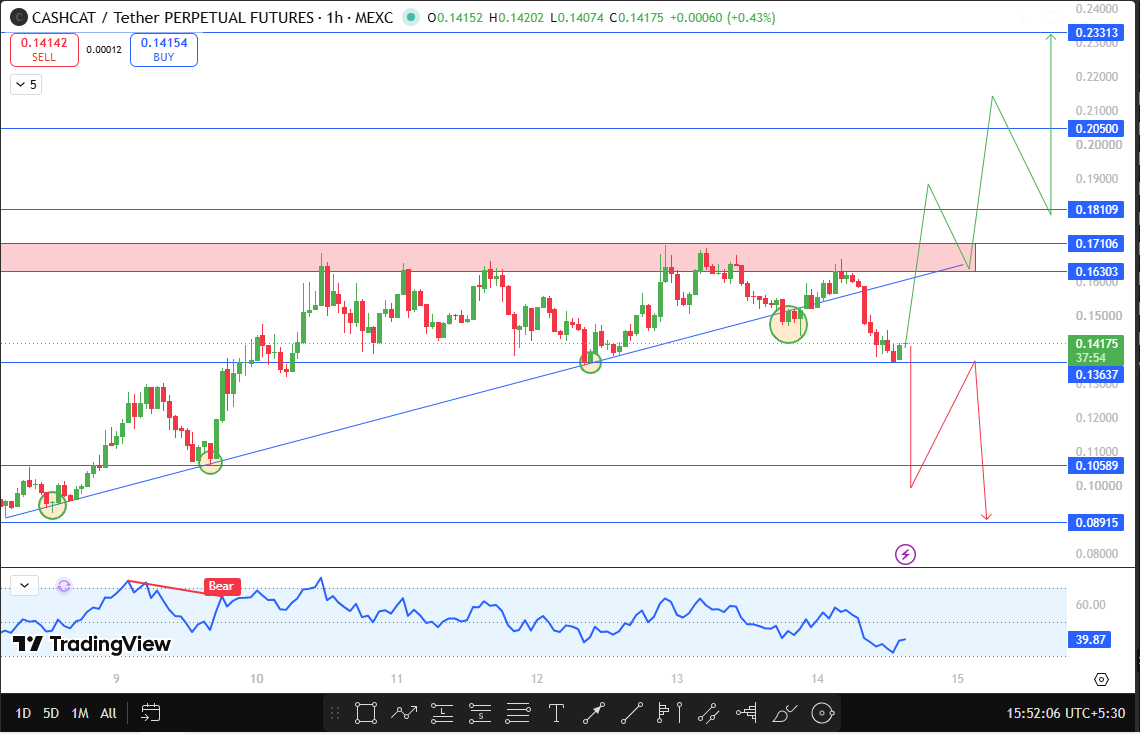
Price broke down through the trendline, attempted a retest back toward it, and has since fallen again, though notably it has not yet broken below its recent swing low at 0.13637.
The chart's momentum oscillator is currently reading 39.87, sitting below the midline after flashing a Bear signal a few sessions ago.
That reading fits with the loss of upward momentum since the trendline break, though the fact that the recent low remains intact suggests sellers have not fully taken control just yet.
If price can reclaim the flip zone and close above 0.18109 while sustaining there, it would point to the breakdown being reversed and open the door toward the higher resistance levels.
If instead the recent low at 0.13637 gives way and the price closes below 0.10589, that would confirm the breakdown and shift focus to the lower support levels.
Technical Outlook Snapshot
Indicator | Signal |
Pattern | Ascending trendline breakdown, retested, recent swing low still intact |
Momentum Oscillator | 39.87, below midline, prior to the Bear tag this week |
Immediate Resistance | 0.18109, flip zone reclaim trigger |
Immediate Support | 0.13637, unbroken recent swing low |
Bias | Cautious while on recent low holds, bearish if it breaks |
Support and Resistance Levels to Watch
Type | Level | Note | % From CMP |
Resistance 2 | $0.23313 | Recent swing high | +64.47% |
Resistance 1 | $0.20500 | Recent swing high | +44.62% |
Immediate Resistance | $0.18109 | Flip zone reclaim trigger | +27.75% |
Flip Zone | $0.16303 to $0.17106 | Former resistance zone, needs sustained reclaim | +15.02% to +20.68% |
Immediate Support | $0.13637 | Recent swing low, not yet broken | -3.79% |
Support 1 | $0.10589 | Breakdown confirmation trigger | -25.30% |
Support 2 | $0.08915 | Recent swing low | -37.11% |
Risk-Reward Table
Case | Trigger | Target |
Bullish | Close and sustain above $0.18109. | $0.20500, then $0.23313 |
Bearish | Close below $0.10589 | $0.08915 |
A confirmed close above the flip zone at 0.18109 with the price holding there would validate a reversal of the breakdown, while a close below 0.10589 is the level that would confirm the breakdown is playing out in full.
Downside Risks to Keep in Mind
Trendline breakdowns that are still being retested can swing sharply in either direction, so traders should watch for a confirmed hourly or higher close rather than reacting to a single wick around the recent swing low.
CASHCAT's relatively short trading history and the extreme percentage swings visible in its longer timeframe data are a reminder that liquidity and volatility can shift quickly on a token this new.
Anyone trading this setup with leverage should size positions carefully given how fast momentum has flipped over the past few sessions.
What Would Change This Cash Cat Price Prediction?
This CASHCAT technical outlook depends on whether the recent swing low at 0.13637 holds.
A confirmed close below 0.10589 or a reclaim of the flip zone above 0.18109 would each be a trigger to revisit this Cash Cat price prediction and adjust the targets.
Until one of those levels breaks, the current low remains the level to watch most closely.
When This Cash Cat Price Prediction Gets Revisited
This setup will be revisited if CASHCAT delivers a confirmed close below 0.10589 or reclaims 0.18109, or if 24 hours pass without either level breaking, in which case the current range around the recent low will need to be reassessed.
Glossary
Flip Zone: A price area that has acted as resistance or support in the past and is being tested to see which role it plays going forward.
Ascending Trendline: An upward-sloping line connecting a series of higher lows, often acting as dynamic support during an uptrend until it is broken.
Open Interest: The total number of outstanding futures contracts that have not been settled, used as a gauge of capital flowing into or out of a market.
Swing Low: A recent low point on the chart from which price has bounced, used as a reference level to judge whether a downtrend is continuing or reversing.
Bull, Base, and Bear Case
Bull Case: CASHCAT defends its recent low at 0.13637, reclaims the flip zone with a close above 0.18109, and pushes toward 0.20500 with 0.23313 as the extended target.
Base Case: CASHCAT continues to hover around its recent low without a decisive close in either direction as the market waits for clearer momentum.
Bear Case: CASHCAT breaks below 0.13637, confirms the breakdown with a close under 0.10589, and slides toward the 0.08915 swing low.
Disclaimer
This article is for informational purposes only and should not be considered financial or investment advice. Cryptocurrency markets are highly volatile, and prices can change rapidly. CoinGabbar and the analyst do not hold a position in CASHCAT at the time of publication. Readers should conduct their own research and consult a qualified financial advisor before making any investment decisions.

















