57K Holders Fuel $CASHCAT Breakout Hopes: CashCat Price Prediction


This cashcat price prediction lands at a pivotal moment for the token. $CASHCAT built its early reputation purely on Robinhood Chain hype after its July 2026 launch, and that momentum resurfaced hard following its direct listing on the Robinhood app on August 6, 2026.
Today $CASHCAT trades at $0.1432, down about 10.7% over the past day, with the token consolidating below its recent $0.165 intraday high rather than trending cleanly in either direction.
With a circulating supply of 988.7 million tokens against a 1 billion max supply, $CASHCAT has very little future dilution ahead nearly the entire supply is already out, which puts the weight of price action almost entirely on demand and trading flow rather than new unlocks.
This article breaks down where $CASHCAT stands today against that backdrop, not just where the charts point next.
$CASHCAT Live Market Data
$CASHCAT is currently trading at $0.1432, down roughly 10.7% on the day. The 24-hour range has spanned $0.1356 to $0.165.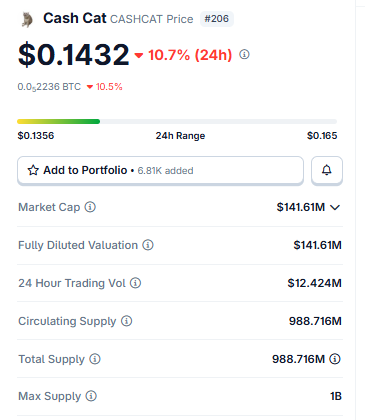
Source: $CASHCAT market data taken from live exchange feeds, as of Aug 12, 2026. Figures may vary slightly across other tracking websites.
Market cap stands near $141.61 million, matching its fully diluted valuation of $141.61 million, since nearly all 988.7 million tokens are already circulating.
Trading volume over the last 24 hours came in around $12.4 million, modest but active for a memecoin at this market-cap tier.
Exchange Volume of $CASHCAT
Hyperliquid leads CASHCAT futures volume at roughly $9.68 million, with Bybit close behind at about $8.67 million.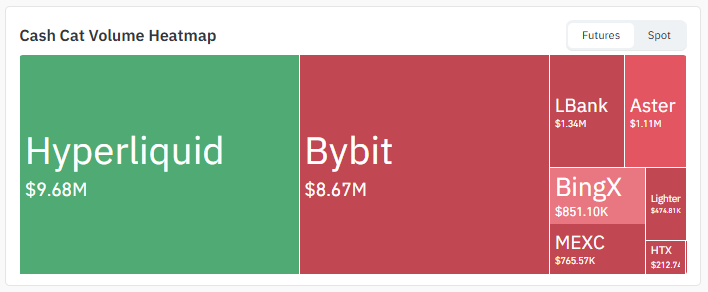
Source: Volume heatmap data taken from Coinglass .
LBank ($1.34M) and Aster ($1.11M) follow, with BingX ($851K), MEXC ($765K), Lighter ($475K), and HTX ($212K) rounding out the smaller venues.
That heavy concentration on just two exchanges means a single large order on Hyperliquid or Bybit can move the broader market price quickly.
It's worth keeping in mind before reading too much into any single sharp candle.
$CASHCAT News Today
On-chain and community trackers flagged a notable growth signal this week: CASHCAT's holder count has climbed past 57,681 wallets and is still climbing, according to posts tracking the token's ecosystem activity.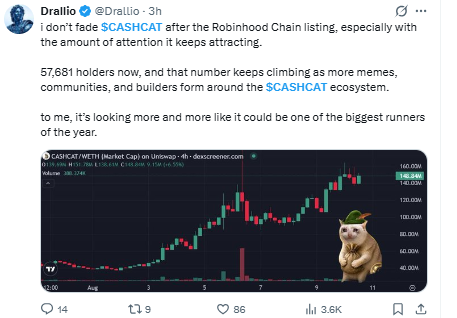
Source: Community data referencing CASHCAT holder growth and ecosystem activity, shared publicly on X.
That kind of steady holder growth, alongside continued attention following the Robinhood Chain listing, often reflects broadening retail interest, though it doesn't by itself confirm which direction price breaks next.
Community sentiment has stayed largely bullish since the listing, with some accounts framing $CASHCAT as one of the better-performing memecoins of the year so far, a narrative tailwind that could support a bullish cashcat price prediction if the chart levels below cooperate.
Key Takeaways
-
CASHCAT is trading around $0.1432, down 10.7% over the past 24 hours after fading from a $0.165 high
-
On the 4H chart, price is holding inside an ascending channel, with a break above $0.1650 opening room toward $0.1900
-
The daily chart shows the price sitting right at the 50% Fibonacci retracement near $0.1397.
-
Volume heatmaps have stayed light relative to the size of recent price swings
-
Holder count has crossed 57,681 and continues climbing since the Robinhood Chain listing
Technical Analysis of $CASHCAT
4-Hour Chart Analysis for CashCat Price Prediction
The 4H chart shows $CASHCAT holding inside a well-defined ascending channel, currently trading around $0.1448.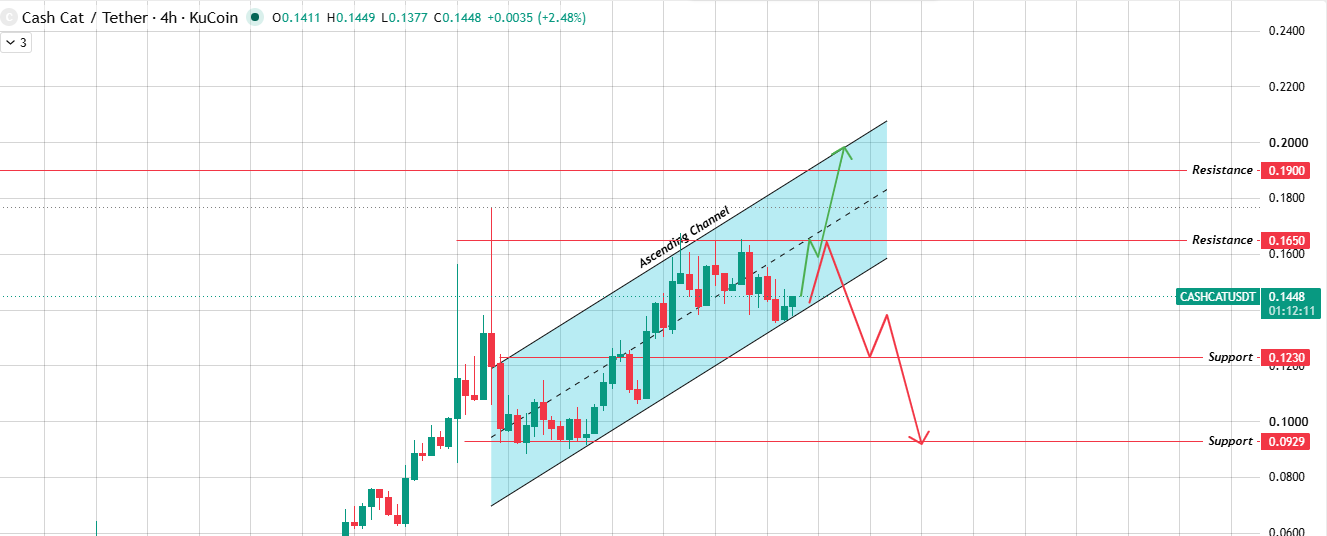
Source: Chart data, 4H timeframe , KuCoin CASHCAT/USDT.
If the price breaks and holds above the channel's supply zone, the next resistance is $0.1650, followed by $0.1900 above that.
If instead the price breaks down through the channel's lower boundary, support sits at $0.1230, with $0.0929 as the next level below that.
Daily Chart Analysis for CashCat Price Prediction
On the daily chart, $CASHCAT is trading right around the 50% Fibonacci retracement near $0.1397, measured from the post-launch low ($0.0894) to the recent local high ($0.1900).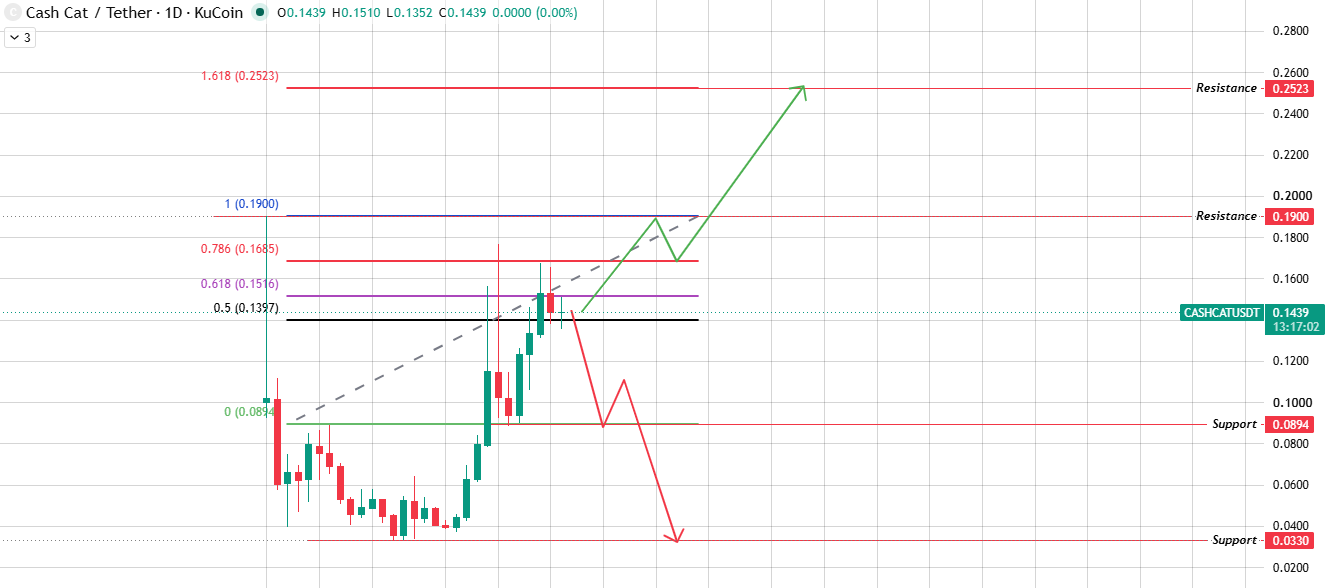
Source: Chart Taken From TradingView.
A daily close above the 61.8% level ($0.1516) would strengthen the case for a push toward $0.1685, then $0.1900, a level that lines up closely with the token's prior high.
Clearing $0.1900 opens room toward the 161.8% extension near $0.2523.
If the price instead breaks down through $0.0894, the next support shelf sits at $0.0330.
Both timeframes point to the same conclusion: $CASHCAT is sitting at a decision point, and the next volume-backed move will likely set the tone for the weeks ahead.
Bull / Base / Bear Case
Glossary
Ascending Channel: Price moves higher here, bouncing between two upward-sloping trendlines until it breaks one side.
Fibonacci Retracement: A set of horizontal levels derived from a prior price swing, used to gauge potential support/resistance during a pullback or recovery.
Liquidation: When an exchange forcibly closes a leveraged position because the trader ran out of margin.
Open Interest: The total value of outstanding futures/derivatives contracts that haven't yet been settled or closed.
Support Zone: A price floor where buying pressure has historically stepped in.
Resistance Level: A price ceiling where selling pressure has historically capped upward moves.
Methodology
Levels used in this CashCat price prediction come directly from chart data on the 4H and 1D timeframes. Liquidation, open interest, and volume figures are referenced from futures-tracking sources. No price levels are extrapolated beyond what appears on the charts.
Disclaimer: This article is for informational purposes only and should not be treated as financial advice. Cryptocurrency markets, especially low-cap memecoins like CASHCAT, are highly volatile, and prices can change quickly. Always do your own research and consult a financial advisor before making investment decisions.

















